Geoscience Reference
In-Depth Information
a
b
Core Business
Commercial
Mixed
Residential
Airports
Parks
HD Res.
LD Res.
Business
Mixed
Infra
Parks
Other
c
d
2.5
1.5
SMS
SMS
0.
1
2
1.5
0
1
−0.5
0.5
−1
0
3
1
Calls
Calls
2.5
0.5
2
1.5
0
1
−0.5
0.5
0
−1
2.5
1
Request
Request
2
0.5
1.5
0
1
−0.5
0.5
0
−1
2.5
1
UL data
UL data
2
0.5
1.5
0
1
−0.5
0.5
0
−1
2.5
1
DL data
DL data
2
0.5
1.5
0
1
−0.5
0.5
0
−1
Mon
Tue
Wen
Thu
Fri
Sat
Sun
Mon
Tue
Wen
Thu
Fri
Sat
Sun
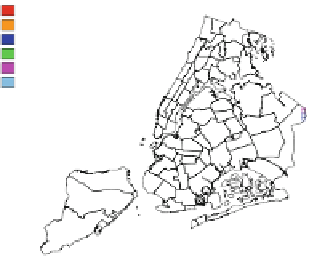
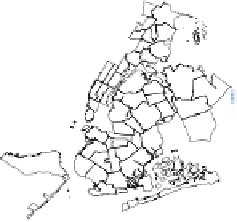
Fig. 15.7 New York clusters
.(
a
) Spatial projection of K D 6 clusters, with their interpretation
in the legend (see details in main text). (
b
) Actual land use maps as extracted from census data. (
c
)
Signatures of the clusters in the different components of activity. (
d
) Deviations of the signatures
compared to the whole city signatures displayed on Fig.
15.4
. Colors on the signature plots match
those on the cluster map (
a
), and
gray areas
correspond to zones with no recorded data
population and job densities within the clusters (when available), as well as
confusion matrices highlighting the similarities between our clusters and the land
use classes.
A few patterns are easy to interpret and compare with census data. For exam-
ple:
Cluster 1 (in red). In all cities, these clusters' signatures present high levels of
activities during working hours and very low levels of activity in the evening


Search WWH ::

Custom Search