Geoscience Reference
In-Depth Information
a
b
Core Business
Commercial
Mixed
Reside
nti
a
l
HD Res.
LD Res.
Business
Mixed
Infra
Parks
Other
Commuting hubs
Residential
c
d
3
1
SMS
SMS
2.5
0.5
2
1.5
0
1
−0.5
0.5
0
−1
3
1
Calls
Calls
2.5
0.5
2
1.5
0
1
−0.5
0.5
0
−1
3
1
Request
Request
2.5
0.5
2
0
1.5
−0.5
1
−1
0.5
0
2.5
1
UL data
UL data
2
0.5
1.5
0
1
−0.5
0.5
0
−1
2
1
DL data
DL data
1.5
0.5
1
0
0.5
0
−0.5
Mon
Tue
Wen
Thu
Fri
Sat
Sun
Mon
Tue
Wen
Thu
Fri
Sat
Sun
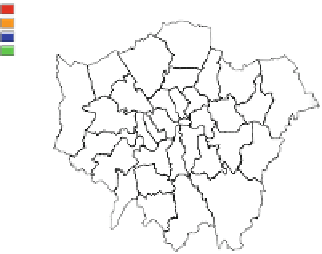
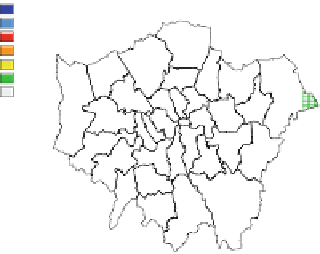
Fig. 15.6 Greater London clusters
.(
a
) Spatial projection of K D 6 clusters, with their
interpretation in the legend (see details in main text). (
b
) Actual land use maps as extracted from
census data. (
c
) Signatures of the clusters in the different components of activity. (
d
) Deviations of
the signatures compared to the whole city signatures displayed on Fig.
15.4
. Colors on the signature
plots match those on the cluster map (
a
), and
gray areas
correspond to zones with no recorded data
clusters on a map of the cities. First of all, it is worth noting that the clusters
are made of spatially cohesive groups of pixels shaping a concentric-like structure
within the cities. The signatures of the clusters as well as their deviation from
their city signature are displayed on Figs.
15.6
c,d-
15.8
c,d, and Table
15.3
lists
the share of total activities occurring within the surface covered by the clusters.
To better understand the nature of the clusters and their relation with standard
land use classification, Figs.
15.6
b-
15.8
b display land use maps of the cities built
from extracted census data (see Sect.
15.2.2
). Finally, Table
15.4
lists the average


Search WWH ::

Custom Search