Information Technology Reference
In-Depth Information
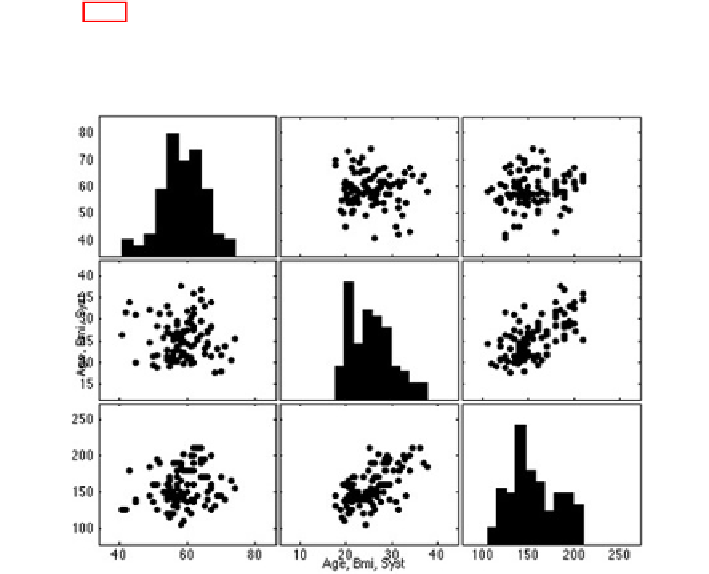
Figure 18.2 depicts the histograms and scatter plots of this set. We notice that
there seems to be a positive correlation between
Bmi
and
Syst
, whereas the rest of
the correlations are less obvious.
Fig. 18.2
Histograms and scatter plots of 98 persons in the case of variables age, body mass
index and systolic blood pressure
18.3.1
Prelude - Fuzzy Cluster Analysis
In computational intelligence modeling we mainly apply fuzzy systems and their
fine-tuned versions below, viz. neuro-fuzzy and genetic-fuzzy systems. Hence, if a
data set is available, we first examine the data clusters in a multi-dimensional space
and then we construct our models according to these clusters.
If the traditional
k
-means clustering is used, we obtain the cluster centers in Table
18.1 Seven clusters were selected because then the
F
ratio, the ratio of the variance
between the clusters to the variance within the clusters, was high. However, now we
operate with crisp clusters, and thus each person is forced to have a full membership
to a certain cluster and a full non-membership to the other clusters [18].
The fuzzy clustering methods, such as the fuzzy
c
-means (FCM) and mountain
clustering methods (MC), will also take into account the borderline cases, and thus
the persons or objects may also have partial memberships to clusters [2-4], [8],[20].
In this manner we may acquire more thorough information on our data set and even
avoid misclassifications. Table 18.2 shows the corresponding cluster centers when
the FCM, which is the fuzzified version of the
k
-means clustering, is used in our
data.