Information Technology Reference
In-Depth Information
Table 18.1
Final cluster centers when traditional
k
-means clustering is used
Cluster
1 2 3 4 5 6 7
Age
57 56 57 47 64 62 63
Bmi
21 24 30 26 26 23 31
Syst
119 151 185 132 164 139 202
Table 18.2
Cluster centers when FCM is used
Cluster
1 2 3 4 5 6 7
Age
58 62 56 56 64 62 56
Bmi
30 26 24 24 23 31 22
Syst
184 165 139 151 140 201 120
In practice the FCM calculates the weighted distances between the data points
and the tentative cluster centers, and these weights base on the degrees of member-
ships of the points to the cluster centers. We obtain the optimal outcomes when the
centers in the densest clusters are selected.
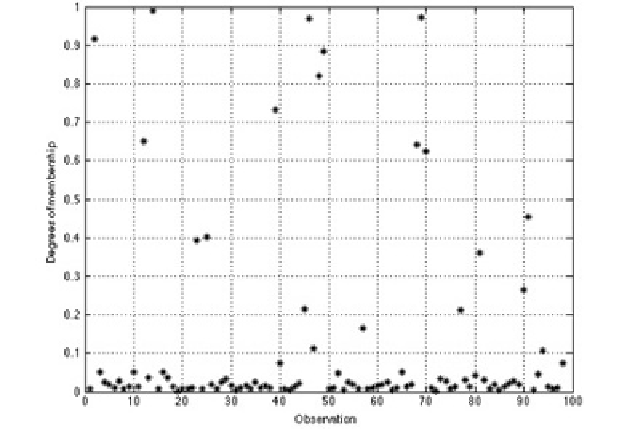
Figure 18.3 depicts the degrees of membership of the persons to the first cluster
the center of which is
Age
184. This means that one
typical group of persons in our data is having this approximate age, body mass index
=
58,
Bmi
=
30 and
Syst
=
Fig. 18.3
Degrees of membership of persons to the first cluster in Table 3.2 in our data set
when FCM is applied