Biomedical Engineering Reference
In-Depth Information
index of BK7 at the He
Ne wavelength is 1.515, the displacement introduced by the beam
splitter cube is around
Δs
5
6.6 mm. Thus, the effective distance between the test target and
the CCD is 29.4 mm. Obviously, the reference beam is also forced to diverge from a distance
equal to 29.4 mm in front of the CCD in order to get imaging at the Fourier domain.
Using this effective distance and the theoretical specifications of the CCD, the NA and the
resolution limits in the H and V directions are NA
HOR
5
0.11 and NA
VER
5
0.08, and
R
HOR
5
5.74
m (130 lp/mm), respectively.
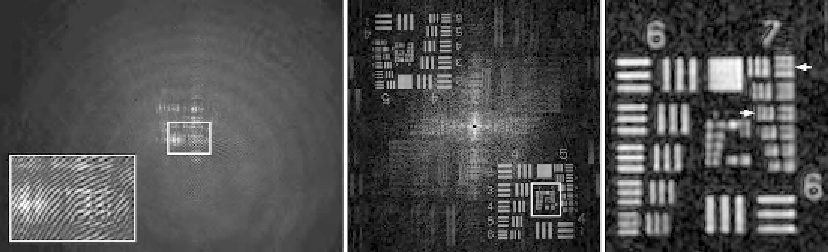
Figure 9.7
shows the recorded hologram, its FT, and a magnified image of the region of interest when
on-axis illumination is used. We can see as the smallest resolved details (marked with white
arrows in (C)) have a size of 6.21
μ
m (174 lp/mm) and
R
VER
5
7.72
μ
m (G7-E1 with
128 lp/mm) in the H (vertical bars) and V (horizontal bars) directions, respectively.
Although these values are a little bit lower than the theoretical ones, they are in good
concordance with the theoretical values since the following element in the resolution test is
below the diffraction limit (G7-E4 and G7-E2 have a details size of 181 and 144 lp/mm,
respectively). Additionally, the illuminated object's field of view must be limited.
Otherwise, the twin image should affect the real image and vice versa. In our case, we have
used a 2D square aperture to limit the extension of the illumination beam at the input plane.
μ
m (G7-E3 with 161 lp/mm) and 7.81
μ
Then, we perform the proposed superresolution approach by shifting and rotating the
illumination prism to the off-axis positions. Also, the double slit is moved together with the
prism to maintain the field of view limitation. To provide tilted beam illumination, the
incident laser beam is expanded by using a pinhole in combination with a collimation lens.
Thus, incident laser light is obtained over the whole set of off-axis positions where the
illumination prism is moved. Similarly to
Figure 9.2
,
Figure 9.8A
shows both the four
recovered bandpass images when tilted beam illumination is performed (outer images) and
(A)
(B)
(C)
Figure 9.7
Negative 1951 USAF test target results using SALDHM: (A) recorded hologram with the inset
showing the fringes; (B) FT of (A). (C) Magnification of the test region of interest (marked with a
white rectangle in (B)).

Search WWH ::

Custom Search