Biomedical Engineering Reference
In-Depth Information
(A)
(B)
(C)
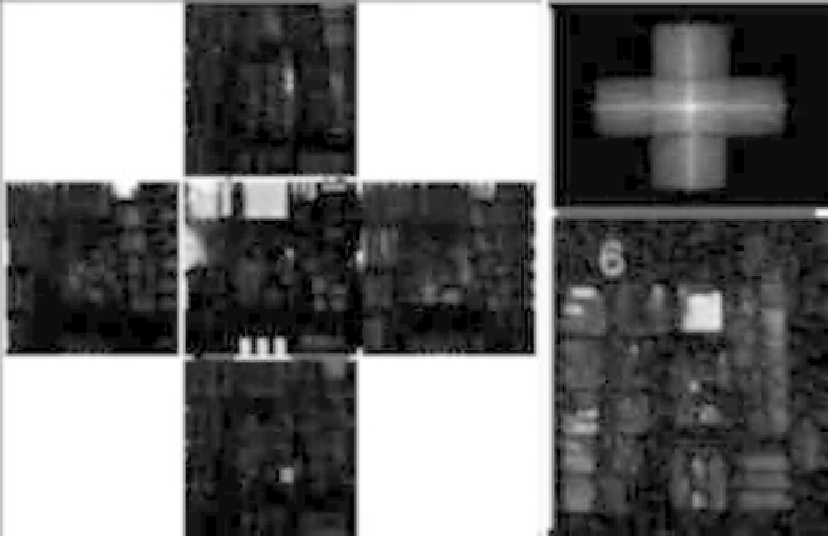
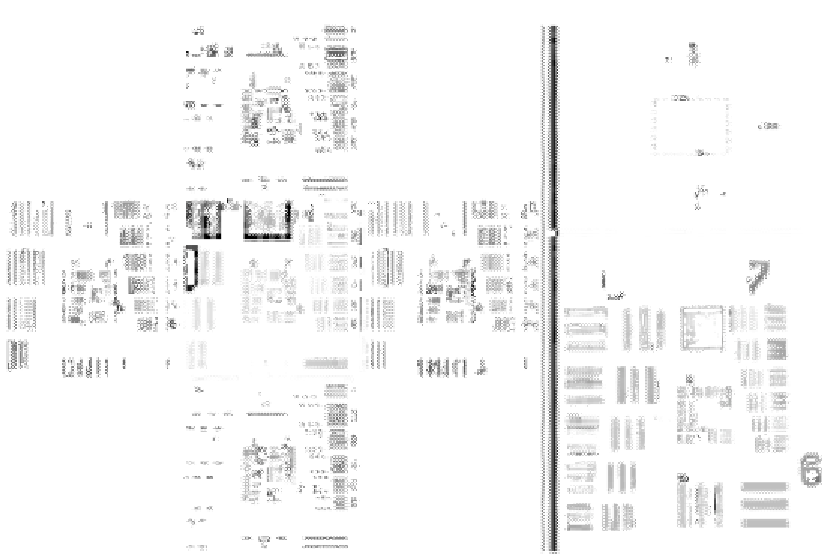
Figure 9.8
(A) Recovered bandpass images of the proposed SALDHM incoming from on-axis (central image)
and off-axis (four outer images) illuminations: (B) generated SA and (C) superresolved image.
The off-axis illuminations are provided by the first illumination ring.
the conventional low-resolution image incoming from the use of on-axis illumination (inner
image). The SA and the superresolved image are depicted in
Figure 9.8B and C
,
respectively. According with theoretical calculations, the SNA and the superresolution
limits in H and V directions are given by SNA
HOR
5
NA
HOR
1
NA
ILUM
5
0.28 and
SNA
VER
5
NA
VER
1
NA
ILUM
5
0.25, and SR
HOR
5
2.26
μ
m (442 lp/mm) and
SR
VER
5
2.53
m (395 lp/mm), respectively. From
Figure 9.8C
, we can see that the last
resolved elements (marked with a white arrow) are G8-E5 (406 lp/mm) and G8-E4 (362 lp/
mm) in H and V, respectively. Once again, these experimental values agree with the
theoretical ones since the next elements in the USAF test are below the superresolved
diffraction limit: G8-E6 (456 lp/mm) and G8-E5 (406 lp/mm) for H and V directions,
respectively. With these values, the resolution gain factors are 2.5 and 3 for both H and V
directions, respectively.
μ
In addition, we present a second experiment with the USAF test target to demonstrate
improved performance. By considering a second illumination ring at twice the oblique
illumination angle of the first ring, it is possible to expand up the synthetic cutoff frequency by
Search WWH ::

Custom Search