Hardware Reference
In-Depth Information
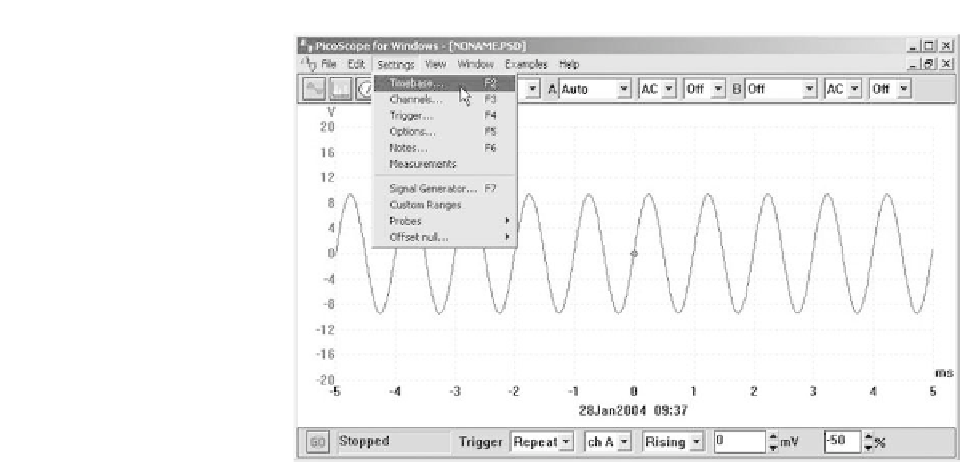
Figure 11.4
The DSO control settings can be changed by using the drop-down
menus as well as the tool buttons and controls provided in the display window
Waveform display
The most common use of an oscilloscope is that of displaying waveforms. In
this respect the operation of a DSO is very similar to that of a conventional
oscilloscope. You simply need to select the required voltage scale and timebase
settings, and this can be done by pointing and clicking on the control buttons
and drop-down selection boxes. Thus, for basic waveform measurements there
is usually no need to use the menu system.
Figure 11.5 shows a 10 V peak-peak sine wave at 1 kHz displayed with the
voltage scale on its 'Auto' (i.e. autoranging) setting and the timebase set to 1 ms
per division. Note that this results in a full-screen timebase scan of 10 ms. In
other words, we are looking at a 10 ms sample of the sine wave.
The Trigger control has also been set to 'Auto' and the trigger point set
to 'Channel A', 'Rising' (i.e. positive going trigger), and 0 mV (i.e. the zero
voltage axis crossing point). Note that the trigger point is shown on the display
as a small grey circle at the origin of the axis (i.e. at
t
=
0 ms and
V
=
0 V).
If only a single cycle of the sine wave is to be displayed the timebase needs to
be set to 100
µ
s per division (as shown in Figure 11.6). Once again, the trigger
point appears at
t
=
0 ms and
V
=
0 V. Note that it is very important to be able
to control the trigger point, particularly where a waveform is non-repetitive in
nature.
Parameter measurement
For accurate parameter measurement cursors may be added to the display in
the form of horizontal or vertical rulers that can be moved using the mouse or
cursor keys. Figure 11.7 shows how a cursor can be added in order to determine