Graphics Reference
In-Depth Information
Figure 4-25.
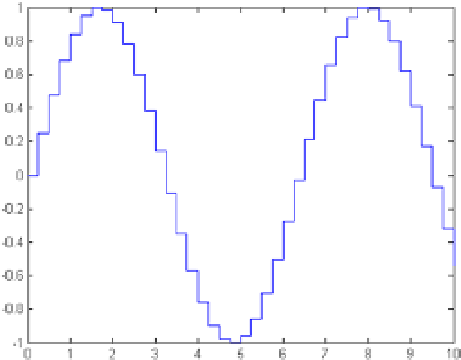
The following example creates a stepped flat graph (Figure
4-26
).
>> x = 0:.25:10;
stairs(x,sin(x))
Figure 4-26.
The following code creates a graph of a three-dimensional scatter plot (Figure
4-27
).
>> [x, y, z] = sphere(16);
X = [x(:) *.5 x(:) *.75 x(:)];
Y = [y(:) *.5 y(:) *.75 y(:)];
Z = [z(:) *.5 z(:) *.75 z(:)];
S = repmat([1 0.75 0.5] * 10, prod(size(x)),1);
C = repmat([1 2 3],prod(size(x)),1);
scatter3(X(:),Y(:),Z(:),S(:),C(:),'filled'), view(-60,60)