Graphics Reference
In-Depth Information
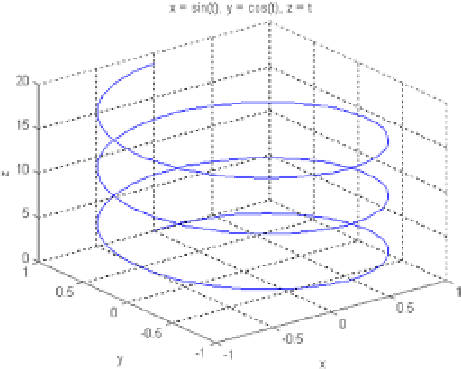
Figure 4-23.
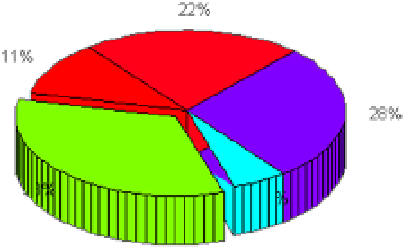
The following example builds a graph in three-dimensional sectors (Figure
4-24
).
>> x = [1 3 0.5 2.5 2];
explode = [0 1 0 0 0];
pie3(x, explode)
colormap hsv
Figure 4-24.
Then create a tape chart for surface
peaks (
Figure
4-25
).
>> [x, y] = meshgrid(-3:.5:3,-3:.1:3);
z = peaks(x,y);
ribbon(y, z)
colormap hsv