Graphics Reference
In-Depth Information
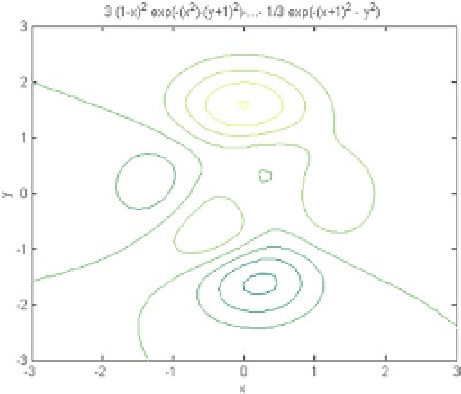
Figure 4-19.
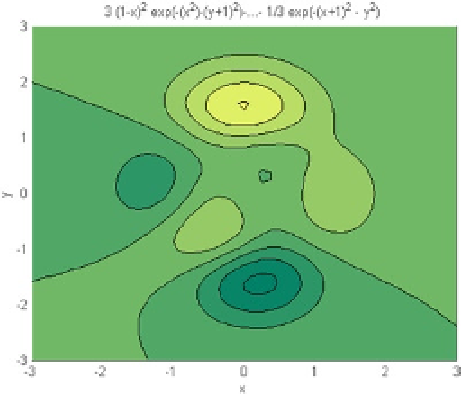
Then we fill the color in the previous contour (Figure
4-20
).
>> ezcontourf(f,[-3,3],49)
Figure 4-20.
In the following example we do a mixed mesh-contour (Figure
4-21
) for the function chart:
y
xy
,
( )
=
fxy
1
++
2
2
>> ezmeshc('y /(1 + x^2 + y^2)', [- 5, 5 - 2 * pi, 2 * pi])
colormap jet