Graphics Reference
In-Depth Information
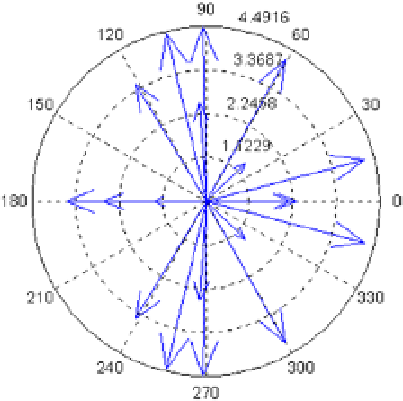
Figure 2-26.
Figure
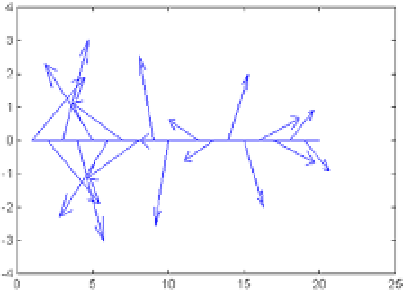
2-27
is going to represent the chart of arrows in the previous example, but with the origin of the arrows in a
horizontal straight line. The syntax is:
>> z = eig(randn (20,20));
>> feather(z)
Figure 2-27.