Graphics Reference
In-Depth Information
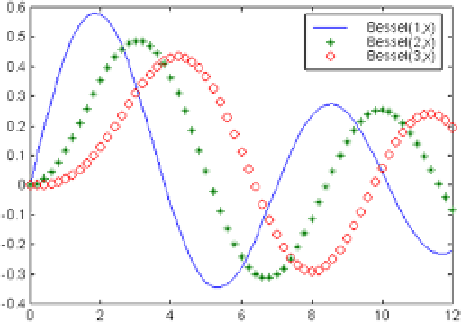
Finally, we will draw on the same axes (Figure
2-28
) the
bessel(1,x)
,
bessel(2,x)
y
bessel(3,x)
functions for values
of
x
between 0 and 12, separated uniformly in two-tenths. The purpose of the chart is to place three legends and
three different types of stroke (normal, asterisks and circles, respectively) to the three functions. The syntax will be as
follows:
>> x = 0:0.2:12;
>> plot (x, besselj(1,x), x, besselj(2,x),'*g', x, besselj(3,x), 'dr');
>> legend('Bessel(1,x)','Bessel(2,x)','Bessel(3,x)');
Figure 2-28.