Graphics Reference
In-Depth Information
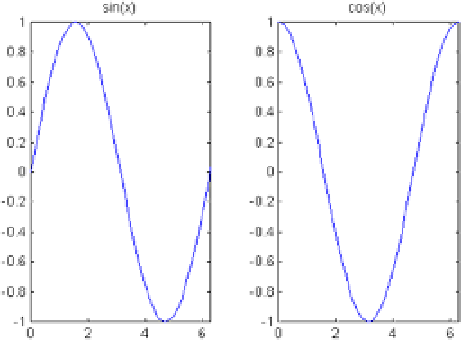
eXerCISe 2-3
present in the same figure the graphs of the functions
Sin(x)
and
Cos (x)
, placed horizontally one next to each other
with their names, with the
x
axis values between 0 and 2 * pi, a shaft, and taking
y
values between - 1 and 1.
also get the vertical representation, so that they one under the other and use slotted shafts.
matlaB, we propose the following entry:
>> x = (0:0.1:2*pi);
>> y = sin(x);
>> z = cos(x);
>> subplot(1,2,1);
>> plot(x,y), axis([0, 2*pi, -1, 1]), title('sin(x)')
>> subplot(1,2,2);
>> plot(x,z), axis([0, 2*pi, -1, 1]), title('cos(x)')
the result is presented in Figure
2-6
:
Figure 2-6.
we now propose to matlaB the following entry to shift the sine curve to the top:
>> x = (0:0.1:4*pi);
>> y = sin (x);
>> z = cos (x);
>> subplot(2,1,1);
>> plot(x,y), axis([0 2*pi -1 1]), title('sin(x)'), grid
>> subplot(2,1,2);
>> plot (x, z), axis([0 2*pi -1 1]), title ('cos (x)'), grid
the result is presented in Figure
2-7
: