Graphics Reference
In-Depth Information
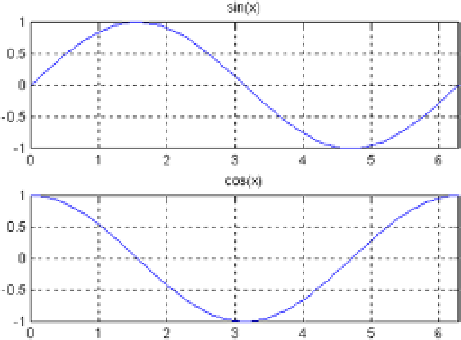
Figure 2-7.
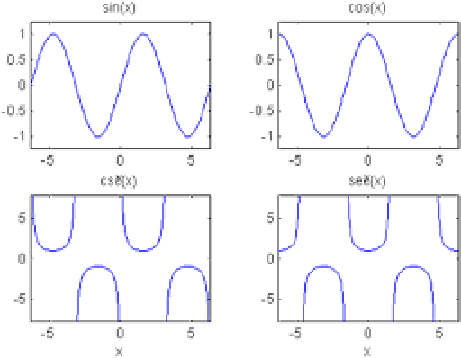
eXerCISe 2-4
present in the same figure, graphs of the functions
Sine (x), Cos (x), Cosec (x)
and
Sec (x)
, placed in a matrix of
four graphics, but under each function place its inverse for
x
ranging from [- 2
p
, 2
p
].
we use the command
subplot
to draw the four functions, in the appropriate order under
Sine (x)
place
Cosec (x)
,
and under
Cos (x)
, place
Sec (x).
the syntax will be as follows:
>> subplot(2,2,1);
>> ezplot('sin (x)', [- 2 * pi, 2 * pi])
>> subplot(2,2,2);
>> ezplot('cos(x)',[-2*pi 2*pi])
>> subplot(2,2,3);
>> ezplot('csc(x)',[-2*pi 2*pi])
>> subplot(2,2,4);
>> ezplot('sec(x)',[-2*pi 2*pi])
matlaB offers as a result the graph of Figure
2-8
.
Figure 2-8.