Graphics Reference
In-Depth Information
5.
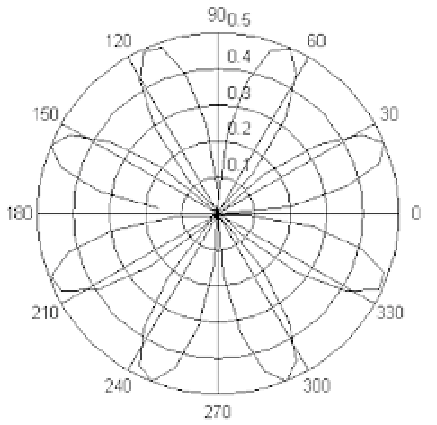
We can represent a planar curve given by its polar coordinates r = Cos (2t) * Sine (2t)
for t varying between 0 and p, taking equally spaced points in one-hundredths of the
considered range. See Figure
1-24
.
>> t = 0:.1:2 * pi;
>> r = sin(2*t).* cos(2*t);
>> polar(t,r)
Figure 1-24.
6.
We can also make a graph of a function considered as symbolic, using the command
“ezplot”. See Figure
1-25
.
>> y ='x ^ 3 /(x^2-1)';
>> ezplot(y,[-5,5])