Graphics Reference
In-Depth Information
3.
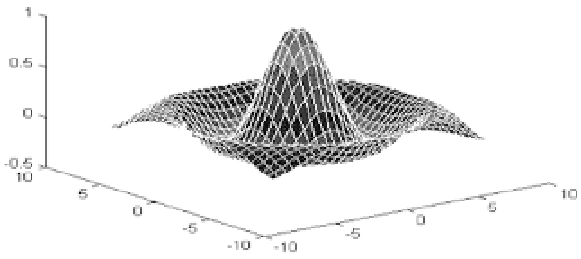
You can generate a graph of the surface for the function z = Sin (sqrt(x^2+y^2)) /
sqrt(x^2+y^2), making the variables (also axes) x and y span the range of -7.5 to +7.5 in
0.5 increments. See Figure
1-22
.
>> x =-7.5:.5:7.5;
>> y = x;
>> [X, Y] = meshgrid(x,y);
>> Z = sin(sqrt(X.^2+Y.^2))./sqrt(X.^2+Y.^2);
>> surf (X, Y, Z)
Figure 1-22.
These 3D graphics allow you to get an idea of the figures in space, and are very helpful in
visually identifying intersections between different bodies, generation of developments of
all kinds and volumes of revolution.
4.
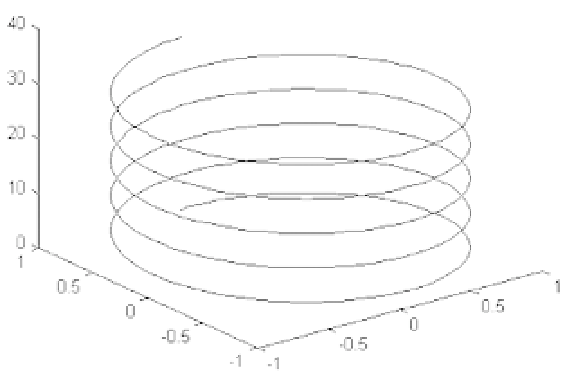
You can generate a three dimensional graphic corresponding to the Helix in parametric
coordinates: x = Sin (t), y = Cos(t), z = t. See Figure
1-23
.
>> t = 0:pi/50:10*pi;
>> plot3(sin(t),cos(t),t)
Figure 1-23.