Graphics Reference
In-Depth Information
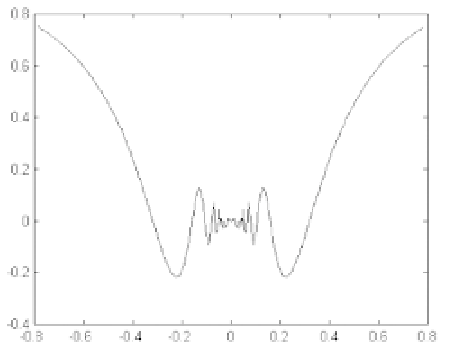
Figure 1-20.
2.
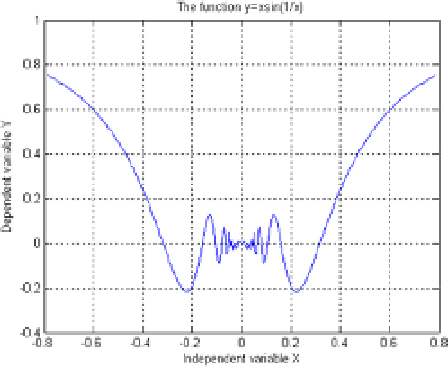
You can give the graph above the options frame and grille, as well create your own chart
title and labels for axes. See Figure
1-21
.
>> x = linspace(-pi/4,pi/4,300);
>> y = x.*sin(1./x);
>> plot(x,y);
>> grid;
>> xlabel('Independent variable X');
>> ylabel ('Independent variable Y');
>> title ('The function y=xsin(1/x)')
Figure 1-21.