Image Processing Reference
In-Depth Information
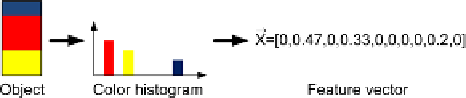
Fig. 9.9
A color histogram
with ten bins and how an
object will be represented
using the color histogram
bins as features
The average color of an object can be a strong feature as it is relatively indepen-
dent on how the shape and size of an object changes. Also, if a color space, where
the intensity and chromaticity are separated, is used, the color feature is relatively
robust to changes in the lighting. Sometimes an object contains multiple colors and
the average may not be the best way to represent such an object. Instead a color
histogram can be used. No matter which color space is used the different color com-
ponents are concatenated and hence results in one histogram. Each histogram bin is
normalized so the sum of all bins is equal to one. This makes the color histogram
invariant to the scale of the object. To reduce the number of features, the resolution
of the histogram bins is usually coarse. An example of a color histogram with ten
bin, i.e., ten features, can be seen in Fig.
9.9
.
While a color histogram is a better representation than the average color, it does
not contain any information about spatial distribution of the different colors. An-
other approach is therefore to divide the object into a number of regions (usually
horizontal dividers) and then represent each region by its average color (or color
histogram). This approach is obvious sensitive to object rotation and care should
therefore be taking before applying it.
As mentioned above the framerate will often be high compared to the movement
of the object and it can therefore be assumed that the object does not change sig-
nificantly from image to image. Inspired by this notion we can simply represent the
object by its pixels and try to refind the object in the next image using template
matching, see Sect. 5.2.1. For this to work the object (or a part of it) needs to be
represented by a rectangle, but more importantly it is assumed that this rectangle
is unique compared to the surroundings. Uniqueness here means the rectangle con-
tains texture—the more the better—which is not repeated in the background. The
level of textureness can be investigated by looking at the amount of edges in the
rectangle. If many strong edges are present with different orientation, then there is
a high likelihood that the rectangle is unique and can be refound in the next im-
age. One concrete way of measuring this is to correlate the rectangle with the Sobel
kernels from Sect. 5.2.2. This will produce two edge images. For each edge image
the absolute value of each edge pixel is found and all these values are summed, and
checked if the sum is above a threshold value. We do the same for the other edge
image and if both sums are above the threshold value the rectangle is concluded to
contain a high level of textureness, hence be a good template to track.
No matter which of these features are applied in tracking, care should be taking
when combining them with the position and/or other features in order to ensure
the different features are scaled properly, see Sect. 7.3. Another important issue is