Information Technology Reference
In-Depth Information
Table 1.
The 11 parameters used in the computer model, with a short description
of their role and their default value. In the Source column, C stands for computed,
M for measured experimentally, L for taken from the literature, and F for parameters
adjusted in order to fit the model to the experiments.
Symbol
Description
Value
Source
Fixed Parameters
R
well
radius of simulation well in # cells
160 cells
C (Sect. 3.3)
Δt
duration of a time step
2 min
/
time step
C (Sect. 3.2)
Δx
grid spacing (diameter of epithelial cells) 11
µ
m
M (Sect. 3.2)
τ
r
duration of the viral replication cycle
7 h
L (Sect. 3.2)
τ
d
± σ
d
infectious cell lifespan (mean
±
SD)
23
±
6h
C(Sect.3.1)
Adjusted Parameters
C
0
fraction of cells initially infected
0.018
F (Sect. 3.3)
5
.
3
×
10
−
4
virions F (Sect. 3.3)
V
0
initial dose of virions per cell
k
infection rate of cells by virions
8
/
h
F (Sect. 3.1)
g
V
rate of viral production per cell
0
.
05
/
h
F (Sect. 3.2)
3
.
18
×
10
−
15
m
2
/
s F (Sect. 3.2)
D
V
diffusion rate of virions
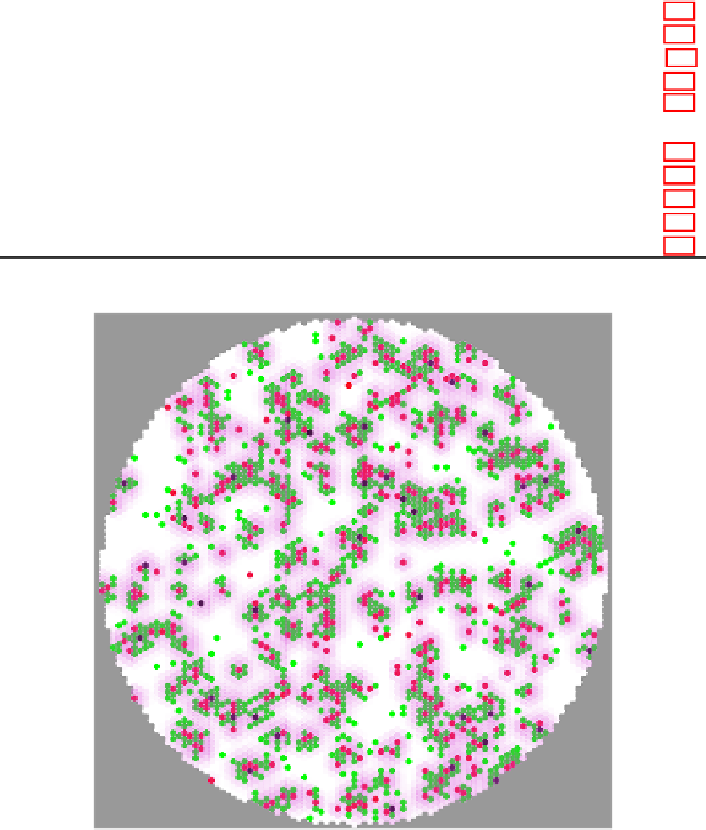
Fig. 4.
Screenshot of the simulation taken at 18 h post-harvest for a simulated grid
(well) containing 5
,
815 cells using the parameter values presented in Table 1. The
cells are color-coded according to their states as in Fig. 1 with healthy cells in white,
containing cells in green, secreting cells in red, and dead cells in black. The magenta
overlay represents the concentration of virions at each site with more opaque magenta
representing higher concentration of virions.