HTML and CSS Reference
In-Depth Information
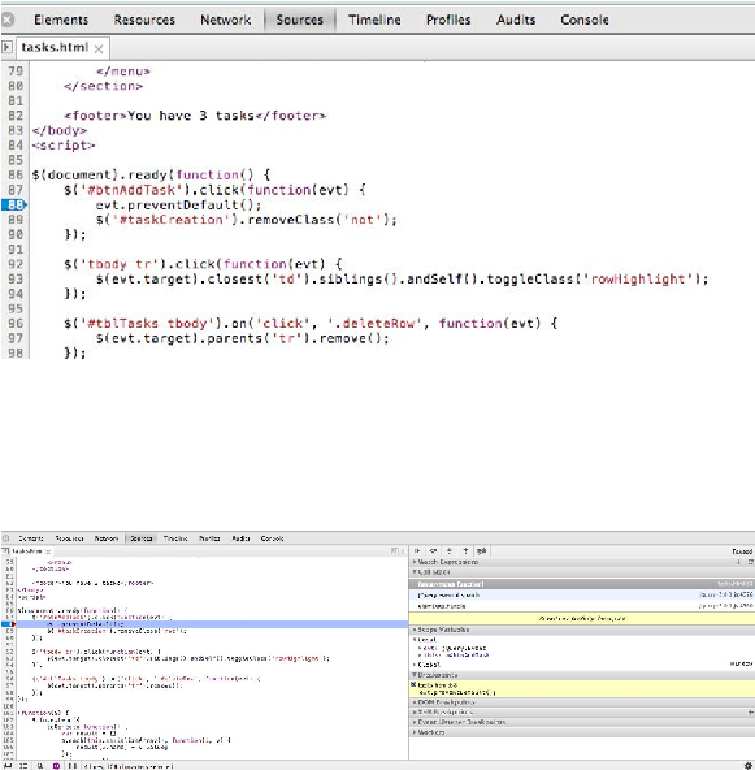
This is a breakpoint, which indicates that the debugger should stop execution when it
reaches this line.
Now, keeping the development tools open, click the “Add Task” button on the main web
page. When you click this, Chrome will stop execution at the breakpoint.
Now that the debugger has stopped at a breakpoint we have several choices.
As a first step, we can interact with the JavaScript environment, including any local vari-
ables that are in scope. You can see on the right hand side that Chrome is telling us there
are two local variables in scope: