HTML and CSS Reference
In-Depth Information
Debugging
Now that we have some working code, it is worth taking a step back to look at the develop-
ment tools that can help when writing JavaScript based web applications.
Probably the most important tool for development purposes is a debugger. Debuggers allow
a software engineer to examine an application while it is running, and therefore analyse the
cause of any problems.
In order to start the debugger, first open the tasks.html page in Chrome. Then use one of the
following approaches to open the development tools:
• Command+Option+i on OSX
• F12 or Ctrl+Shift+I on Windows
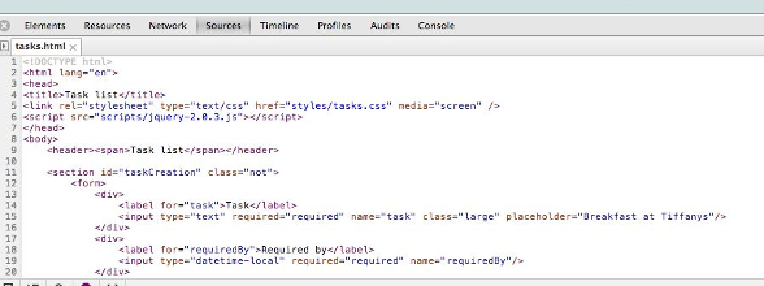
Once the familiar console is open, click on the sources tab:
If you scroll to the bottom of the tasks.html page you will see the JavaScript that has been
added in the previous chapter.
Find the following piece of code in the file:
$('#btnAddTask').click(function(evt) {
evt.preventDefault();
$('#taskCreation').removeClass('not');
});
And click in the left hand margin on the line evt.preventDefault();. The line should highlight
in blue; you will see this on line 88 in the screenshot below, but the line in your version may
differ: