Graphics Reference
In-Depth Information
Trying out ideas: Tanya Holbrook
Tanya Holbrook is a designer for Fallon in London. While studying for her degree in
graphic design she completed a project that mapped her carbon footprint for the year
2007. This project looked at the journeys she had undertaken within that year, such as
walking, driving and flying.
While developing the project, Tanya tried out several ways to interpret the data she
had collected. It had to be analyzed and edited to pick out the most relevant facts and
statistics in order to tell the story of her travels for the year. Certain pieces of inform-
ation appeared too detailed, others not detailed enough. The comparison of local, na-
tional and international had to be made and then some way to portray the data coher-
ently to an audience had to be found. She analyzed the mileage from her cars, looked
at the travel tickets she had kept and also looked at the work of other designers.
She went through the data and edited it, looking at various stereotypical ways that
most designers would use to depict it. The process of editing can be very difficult,
as the designer is trying to select facts, figures or statistics that indicate relationships
or facilitate some sort of comparison. Just telling someone you have travelled 20,000
miles in a year in your car doesn't mean much until you realize the national average
is 8,000 miles. The data needs to be set in context to make it meaningful.
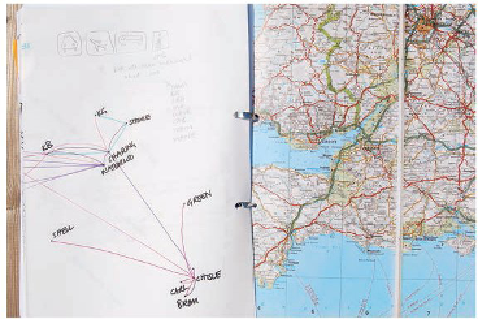
The sketchbook Tanya produced for this project is interesting because she has in-
cluded her references from contemporary design along with drawings and notes on
the data that helped her arrive at her final solution.