Hardware Reference
In-Depth Information
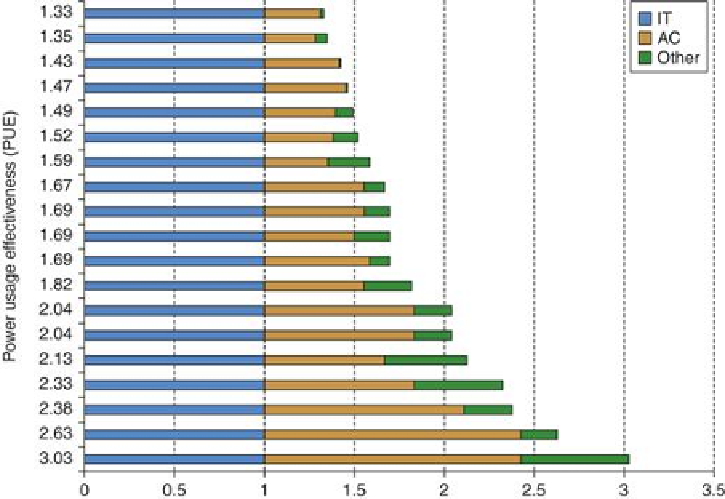
FIGURE 6.11
Power utilization efficiency of 19 datacenters in 2006 [Greenberg et al.
2006]
. The power for air conditioning (AC) and other uses (such as power distribution) is nor-
malized to the power for the IT equipment in calculating the PUE. Thus, power for IT equip-
ment must be 1.0 and AC varies from about 0.30 to 1.40 times the power of the IT equipment.
Power for “other” varies from about 0.05 to 0.60 of the IT equipment.
Since performance per dollar is the ultimate metric, we still need to measure performance.
As
Figure 6.7
above shows, bandwidth drops and latency increases depending on the distance
to the data. In a WSC, the DRAM bandwidth within a server is 200 times larger than within a
rack, which in turn is 10 times larger than within an array. Thus, there is another kind of loc-
ality to consider in the placement of data and programs within a WSC.
While designers of a WSC often focus on bandwidth, programmers developing applications
on a WSC are also concerned with latency, since latency is visible to users. Users' satisfaction
and productivity are tied to response time of a service. Several studies from the timesharing
days report that user productivity is inversely proportional to time for an interaction, which
was typically broken down into human entry time, system response time, and time for the
person to think about the response before entering the next entry. The results of experiments
showed that cuting system response time 30% shaved the time of an interaction by 70%. This
implausible result is explained by human nature: People need less time to think when given a
faster response, as they are less likely to get distracted and remain “on a roll.”
Figure 6.12
shows the results of such an experiment for the Bing search engine, where delays
of 50 ms to 2000 ms were inserted at the search server. As expected from previous studies,
time to next click roughly doubled the delay; that is, a 200 ms delay at the server led to a 500
ms increase in time to next click. Revenue dropped linearly with increasing delay, as did user
satisfaction. A separate study on the Google search engine found that these effects lingered
long after the 4-week experiment ended. Five weeks later, there were 0.1% fewer searchers per
Search WWH ::

Custom Search