Geoscience Reference
In-Depth Information
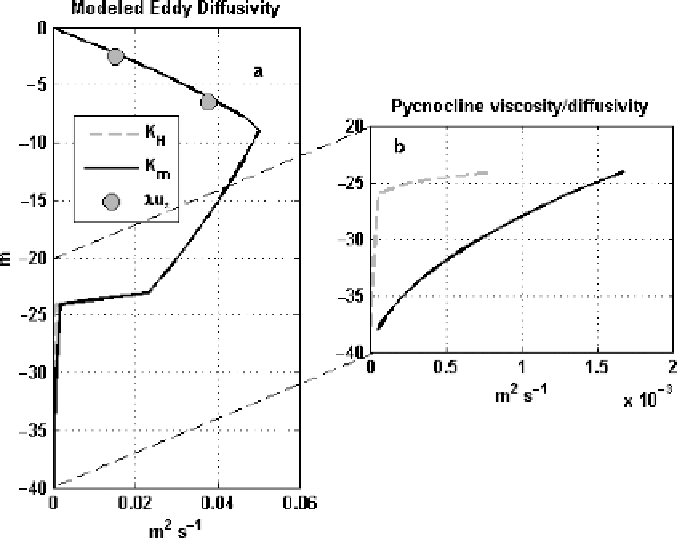
Fig. 9.4
Eddyviscosity andthermal diffusivity after theiterationofFig. 9.3,for theupper 40mof
the 80m model domain
a
and detail in the pycnocline showing the reduction of scalar diffusivity
relativetoviscosity
b
In the upper10m or so of the pycnocline(beginningat about24m) there is still
relatively strong mixing of both momentum and heat, despite the rapid attenuation
of eddy diffusivitiesbecause of upward buoyancyflux. Note that heat flux falls off
in the pycnocline at about the same rate as momentum flux, even though the eddy
thermaldiffusivityismuchsmallerthaneddyviscosity.
To recap, the demonstration shows that given measured profiles of
T
and
S
encompassing the well mixed layer and pycnocline, along with Reynolds stress
measured at one level, a plausible distribution of momentum and scalar fluxes
throughout the entire boundary layer may be constructed, including estimates of
theinterfacialfluxes.Moreinformationisrequired,however,tocharacterizetheen-
tire velocity structure (with respect to the undisturbed ocean velocity), namely, the
undersurface hydraulic roughness,
z
0
. Generally, pack ice measurements are made
from a platform that is moving relative to the underlying undisturbed ocean, and
water velocitymeasuredfromthe ice is notthe absolutevelocityin a fixed-to-earth
referenceframe,butratherthevectordifferencebetweentheabsolutevelocityatthe
measurementdepthandtheicevelocity.Withmodernsatellitenavigation,thelatter
may be measured quite accurately, and provided the orientation of the instruments
is known (not always a trivial problem when dependent on compasses at high lat-
itudes), it is a simple matter to determine the absolute velocity, say for example,