Geoscience Reference
In-Depth Information
Model PD Temperature
0
-
20
0
-
40
-
60
-
80
-
0.5
-
100
-
120
-
1
-
140
-
160
-
1.5
180
-
235
240
245
250
Day of 2005
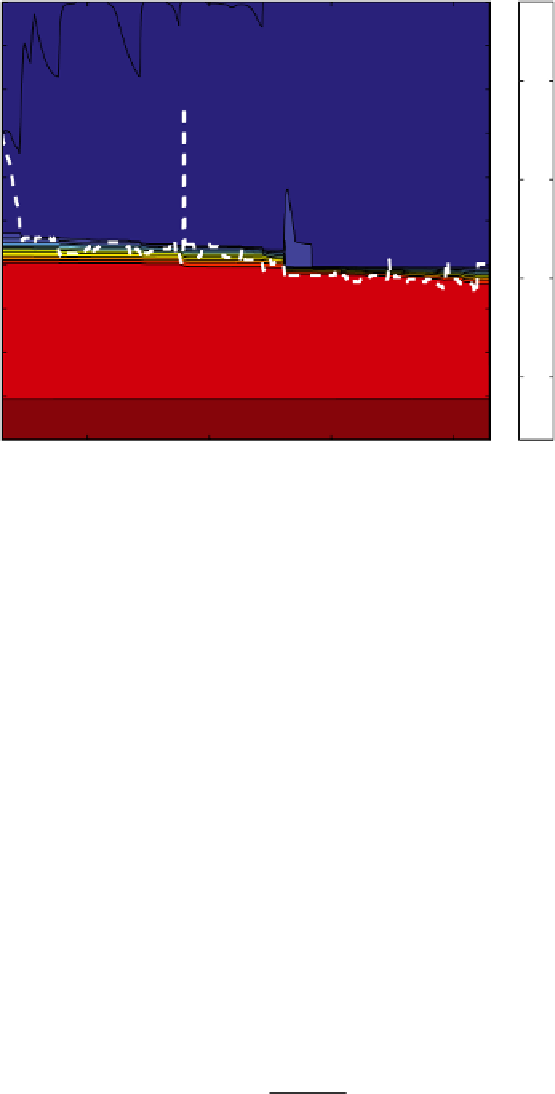
Fig. 8.21
Contours of PD model temperature for the upper 200mof the water column. The white
dashed curve is the dynamic boundary layer depth, below which friction velocity is less than
0
.
5mms
−
1
nearthebaseofthe upperlayer,andarapidincreaseinmixedlayertemperatureby
about0.1K (Fig.8.20a).Notethatbecauseofthelargetemperaturecontrast,minor
deepeningofthewellmixedlayerhaslargeimpactonitstemperature,thusstrongly
reinforcingthe “thermalbarrier”effect.
During the 20-day PD model run, the density contrast between the upper and
lower layers continues to decrease. In Fig. 8.22, the density jump across the ther-
mocline is shown from two perspectives, one in which it is simply the difference
in potential density (dashed), and the second when it is calculated at pressure
corresponding to the depth of the thermocline (solid). The shaded areas are ther-
mobarically unstable, i.e., water just above the thermocline, if displaced slightly
downward, would be heavier than its surroundings. Any subsequent mixture of
upper-andlower-layerwaterwouldbe denserthaneithertypeby itself byvirtueof
thecurvatureofisopyncnalsin
T
S
space(Fig.2.11).Toaddressthisinthecontext
oftheone-dimensionalLTCmodel,weformulatedasimple algorithmasfollows.
Inthefirst-order-closuremodel,buoyancyfluxiscalculatedastheeddydiffusiv-
itytimesthegradientinbuoyancyfrequencysquared,
N
2
/
=(
−
g
/
ρ
)
ρ
z
,whereinthe
modelgridscheme(Fig.7.1)
(
ρ
z
)
i
=
ρ
−
ρ
i
i
−
1
(8.1)
∆
zz
i
−
1