Geoscience Reference
In-Depth Information
∆ρ
=
ρ
pyc
-
ρ
ml
10
x 10
-
3
Potential Density
5
0
In−situ Density
−5
232
234
236
238
240
242
244
246
248
250
Day of 2005
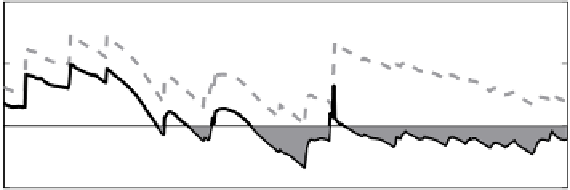
Fig. 8.22
Difference between density inthe upper 5mof thepycnocline and the well mixed-layer
density, determined from potentialdensityand density, where thelatterrefers todensity calculated
at pressure corresponding tothe mixed layer/thermocline interface
In the potential density formulation,
0). If instead, density in
(8.1) were evaluated at pressures corresponding to
zz
i
and
zz
i
−
1
, the gradient (and
buoyancy flux) would be dominated by fluid contraction with pressure, and would
beuselessfordynamicalmodeling.However,anapproximationtotheactual
in situ
densitygradientis
ρ
i
=
ρ
(
T
i
,
S
i
,
p
=
(
ρ
z
)
i
=
ρ
i
[
T
i
,
S
i
,
p
(
z
i
)]
−
ρ
i
−
1
[
T
i
−
1
,
S
i
−
1
,
p
(
z
i
)]
(8.2)
∆
zz
i
−
1
i.e.,wheredensityisevaluatedatpressurecorrespondingtothe
z
i
gridpointmidway
between the two
zz
grid points. For a sharp thermocline/haloclineas in the model,
thismeansthat
in situ N
2
isnegativeintheshadedportionsofFig.8.22,thusalocal
instabilityexists.
Turbulence is enhanced in the LTC model whenever there is negative buoyancy
fluxwithinthescopeofthedynamicboundarylayer,i.e.,withinthezoneinfluenced
by surface stress and buoyancy flux conditions. Consequently, for the conditions
identified above, mixing should be enhanced in a model that calculates density ac-
cordingto(8.2),whichwedesignatetheNESmodel,meaningsomeaccountistaken
of nonlinearities in the equation of state. If surface conditions change—perhaps
rapid melting markedly decreasesturbulence scales in the upper part of the bound-
arylayer—instabilitiesmaypersistbelowalevelwheresurfacedriventurbulenceis
negligible.Inthatcase an
ad hoc
assumptionisthatinstabilitiesbelowthedynamic
boundarylayer(asdefinedabove)willberapidlyrelievedbyothernaturalprocesses
(e.g.,internalwaves).Inpractice,theNESmodeltestsateachtimestepfornegative
N
2
in the region below the dynamic boundary layer, and averages those tempera-
tures and salinities with adjacent values for which the gradient is stable. The NES
modelisidenticaltothePD modelexceptforthese twofactors.
NES model temperature contours (Fig. 8.23) are similar to the PD model
(Fig. 8.21, note that
z
scales are different) for the first half of the 20-day period.
Starting on day 245, however,the NES model reaches static instability and rapidly