Geoscience Reference
In-Depth Information
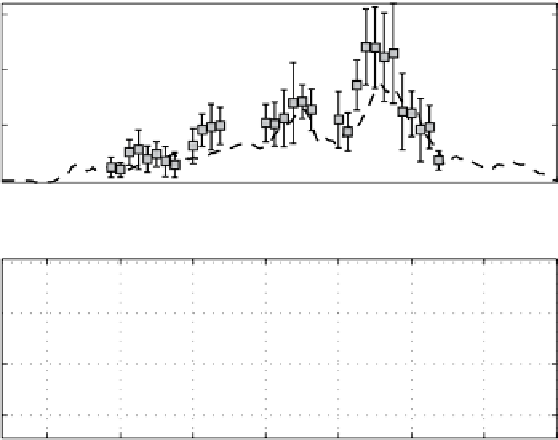
Turbulent Heat Flux at 2 m
30
a
Run Sep 14A
20
10
0
258
259
260
261
262
263
264
265
Turbulent Heat Flux at 6 m
30
b
20
10
0
258
259
260
261
262
263
264
265
Day of 1998
Fig. 8.8
As inFig. 8.7, except turbulent heat flux, ρ
c
p
w
T
It is not nearly as successful, however, at reproducing the mean evolution of
the upper ocean structure. In the model, for example, the well mixed layer salinity
(Fig.8.9a)increasessubstantiallyinresponsetostrongsurfacestressfrom261-263
as more saline water is mixed upward from the pycnocline. Observed salinity de-
creases.Inthemodel,
T
alsoincreasesbyupwardmixingofwarmerwater,counter
to the downward trend in the observations. In the absence of other information, it
would appear then that the model has underestimated the amountof melting, since
inaone-dimensionalview,meltingistheonlysourceoffreshwater,andmorerapid
melting would lower
δ
T
. But contour plots of salinity from the profiler and the
modelpointupsomeothermajordifferences.Inthemodel,theimpactofmixingis
minorbelowabout40mandsalinityinthelowerpartofthemodeldomainremains
the same, while in the data there is an overall freshening trend (downward sloping
isohalines) with an upwelling-like event during the time of maximum stress and a
rapiddeepeningofthewellmixedlayeronday262.
Intheabsenceofmixingfrombelow,theonlysourceofsaltinthemodeldomain
is freezing (positive) or melting of ice. The integrated change in salt over the 60m
domainofrunSep14Ais
δ
0
0
50kgm
−
2
∆
S
=
−
=
−
.
S
end
dz
S
st art
dz
0
−
60
−
60