Geoscience Reference
In-Depth Information
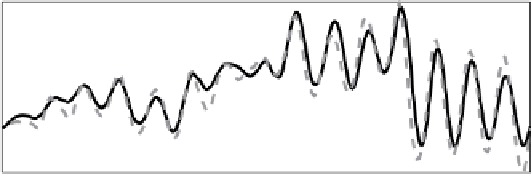
Model Sep14A: Northward Ice Velocity
Data
Model
0.3
0.2
0.1
0
a
-
0.1
258
259
260
261
262
263
264
265
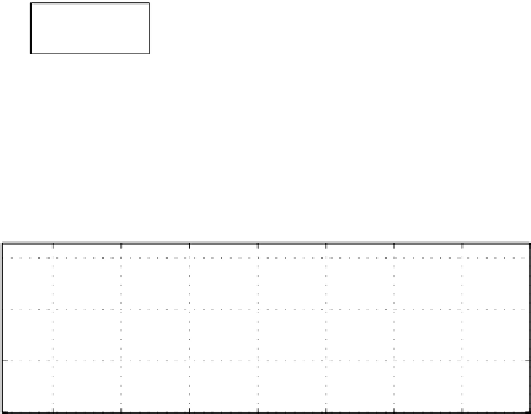
Eastward Ice Velocity
0.2
0
-
0.2
b
0.4
-
258
259
260
261
262
263
264
265
Day of 1998
Fig. 8.6
Observed (solid) and modeled (gray dashed) ice velocity northward
a
and eastward
b
in
theperiodfrom0900UT14September 1998to0000UT22September,for thewinddrivenmodel
run Sep 14A
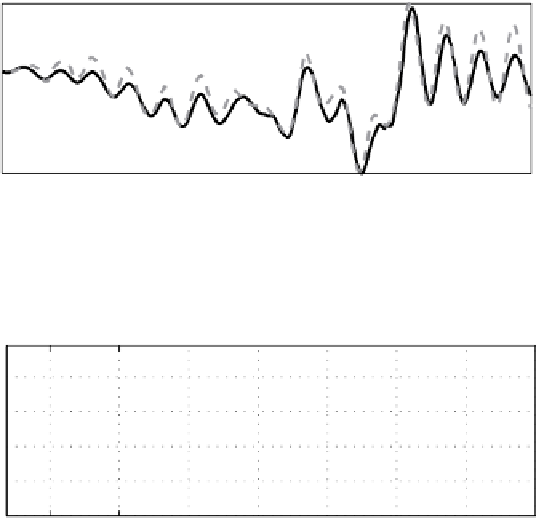
Friction velocity at 2 m
a
0.02
0.015
0.01
Run Sep 14A
0.005
0
258
259
260
261
262
263
264
265
Friction velocity at 6 m
0.02
b
0.015
0.01
0.005
0
258
259
260
261
262
263
264
265
Day of 1998
1
/
2
) for model
u
w
+
u
w
|
Fig. 8.7
Modeled (dashed) and observed (square symbols,
u
∗
=
|
i
run Sep 14A, at2m
a
and 6m
b
from theboundary. Error bars represent
±
one standard deviation
of the 15-min samples ineach 3-h average