Environmental Engineering Reference
In-Depth Information
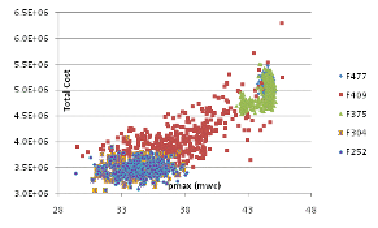
pipes) have been lower than the threshold of 20 mwc, as low as 16-17 mwc. Again, the
selection of GA-settings is the likely reason; repetitive simulations should have been done
by increasing the penalty to arrive at better results. That step has been however skipped
because the two categories are already more expensive and less reliable than the other
three. The most favourable i.e. sufficiently looped samples, have been optimised on the
minimum pressures in the range of 19.5 to 20.5 mwc, which has been considered as
satisfactory.
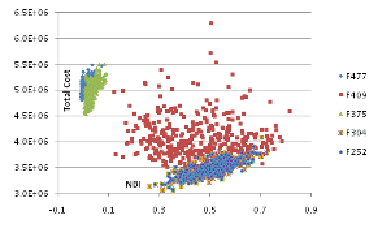
Figure 9.8a
Diagnostics of networks from Table 9.10:
ADF
avg
- left,
NBI
- right
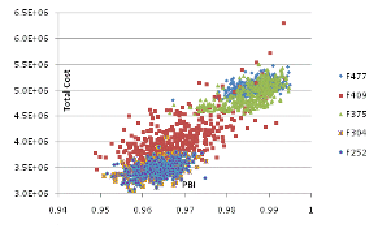
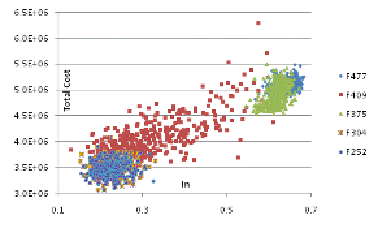
Figure 9.8b
Diagnostics of networks from Table 9.10:
PBI
- left,
I
n
- right
Figure 9.8c
Diagnostics of networks from Table 9.10:
p
min
- left,
p
max
- right
Despite the contradiction between the values of
ADF
avg
and
NBI
on one side, and those of
PBI
and
I
n
on the other side, the focus in the individual assessment of the networks has been
given to the samples of 409 networks (random) and those of 252 and 304 networks (non-
random, complexity category 4). These three samples have been further zoomed-in within the
price range from three to four million and ADF-range between 0.9 and 1, which can be seen
in Figure 9.9.


Search WWH ::

Custom Search