Environmental Engineering Reference
In-Depth Information
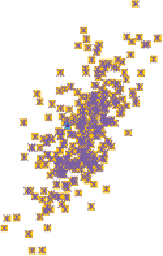
4.0E+06
3.9E+06
3.8E+06
3.7E+06
3.6E+06
F409
F304
F252
3.5E+06
3.4E+06
3.3E+06
3.2E+06
3.1E+06
ADFavg
3.0E+06
0.9
0.92
0.94
0.96
0.98
1
Figure 9.9
The
ADF
avg
values in the cost range between 3 and 4 million
9.5.1 Diagnostics of Single Networks
To illustrate the other features of NEDRA package, six networks have been picked from the
diagram in Figure 9.8a. Two of them represent each of the samples: one as being the
cheapest, and the other as the most reliable i.e. with the highest value of
ADF
avg
. These
networks have been listed in Table 9.11 with the layouts showing the diameters and pressure
distribution shown in Figures 9.10a to 9.10f. Two other layouts have been added to the table,
to give impression about the entire price- and
ADF
avg
range.
Table 9.11
Overview of selected networks
Cost (10
6
)
Net nr.
Batch code
Property
p
min
-p
max
(msl)
ADF
avg
NBI
PBI
I
n
1727
R55-75 (U)
Cheapest
3.46
19.86 - 36.69
0.945
0.362
0.962
0.237
4611
(F409)
Least reliable
5.13
18.58 - 44.08
0.850
0.241
0.987
0.564
3765
Most expensive
6.29
18.13 - 45.67
0.938
0.504
0.993
0.575
3307
Most reliable
4.00
20.01 - 38.28
0.983
0.785
0.962
0.363
691
NfullC4(U)
Cheapest
3.06
19.64 - 31.70
0.948
0.354
0.957
0.209
081
(F252)
Least reliable
3.17
20.03 - 34.74
0.941
0.281
0.955
0.196
508
Most expensive
3.90
19.85 - 32.24
0.971
0.673
0.964
0.192
757
Most reliable
3.76
20.06 - 35.85
0.974
0.696
0.970
0.262
353
N55-75C4(U)
Cheapest
3.06
19.83 - 30.90
0.946
0.312
0.958
0.194
760
(F304)
Least reliable
3.13
19.89 - 35.65
0.939
0.261
0.957
0.251
218
Most expensive
4.07
19.96 - 33.45
0.974
0.704
0.966
0.224
962
Most reliable
3.78
19.47 - 34.90
0.976
0.725
0.969
0.272
The shaded values show the absolute maximum/minimum values regardless the sample. The
most of those originate from the random sample. The other two samples show mutually
similar results given the similar pattern of non-random generation.


Search WWH ::

Custom Search