Environmental Engineering Reference
In-Depth Information
The figures show clearly that:
-
The direct pumping options (
A
) are in general more expensive than the options that
include the balancing tank (
B
).
-
The contribution of O&M cost in the total annual cost is more significant in the case of
options
A
than is the case with options
B
.
-
The contribution of O&M cost in the total annual cost grows with the higher altitude
range. This trend is steadier in case of options
A
than is the case with
B
.
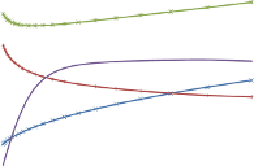
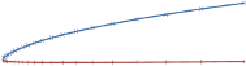
Typical diagrams which show the relation between investment and O&M costs against
reliability measures for particular topographic pattern, altitude range and investment scenario
will look like in Figures 8.24 and 8.25. Figure 8.24 shows the annual costs against the
reliability measures for 21 design scenarios of network
A
, located on the hilly topography (H)
of low altitude range (L) using high investment/high operation cost scenario (HH) on the left,
and high altitude range (H) using low investment/low operation cost scenario (LL) on the
right. Figure 8.25 shows the same situation for the network in a valley (V).
Investment
O&M
Total Cost
NBI
In
Investment
O&M
Total Cost
NBI
In
2,000,000
1.00
2,000,000
1.00
1,800,000
0.90
1,800,000
0.90
1,600,000
0.80
1,600,000
0.80
1,400,000
0.70
1,400,000
0.70
1,200,000
0.60
1,200,000
0.60
1,000,000
0.50
1,000,000
0.50
800,000
0.40
800,000
0.40
600,000
0.30
600,000
0.30
400,000
0.20
400,000
0.20
200,000
0.10
200,000
0.10
-
0.00
-
-
-
2,000
4,000
6,000
8,000
10,000
12,000
14,000
16,000
18,000
-
2,000
4,000
6,000
8,000
10,000
12,000
14,000
16,000
18,000
Network Volume m
3
Network Volume m
3
Figure 8.24
Annual costs (US$) and reliability for 21 scenario of network A/H: left - L/HH, right - H/LL
Investment
O&M
Total Cost
NBI
In
Investment
O&M
Total Cost
NBI
In
2,000,000
1.00
2,000,000
1.00
1,800,000
0.90
1,800,000
0.90
1,600,000
0.80
1,600,000
0.80
1,400,000
0.70
1,400,000
0.70
1,200,000
0.60
1,200,000
0.60
1,000,000
0.50
1,000,000
0.50
800,000
0.40
800,000
0.40
600,000
0.30
600,000
0.30
400,000
0.20
400,000
0.20
200,000
0.10
200,000
0.10
-
-
-
-
-
2,000
4,000
6,000
8,000
10,000
12,000
14,000
16,000
18,000
-
2,000
4,000
6,000
8,000
10,000
12,000
14,000
16,000
18,000
Network Volume m
3
Network Volume m
3
Figure 8.25
Annual costs (US$) and reliability for 21 scenario of network A/V: left - L/HH, right - H/LL
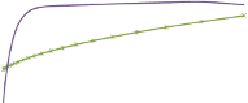
The figures reflect the following:
-
The investment cost is much more determining factor, as far the reliability matters, than
the O&M costs.
-
The O&M costs become significant in the HH cost scenario in the area of low reliability
and their increase is actually detrimental for the network reliability. It shows that the lack
of conveyance capacity in pipes during failure conditions can hardly be compensated by
the increased operation of the pump.


Search WWH ::

Custom Search