Environmental Engineering Reference
In-Depth Information
1.00
Underconnected
0.90
0.80
0.70
net10
net10a
net10b
net16
net16a
net16b
Branched
0.60
0.50
0.40
0.30
0.20
0.10
Overconnected
0.00
0.00
0.20
0.40
0.60
0.80
1.00
1-ADF
Figure 5.5
Loss of demand for nets 10 and 16 at various levels of buffer (D increase)
The following conclusions can be made by analysing position of the dots on such a diagram:
1.
The closer the dots to the Y-axis are, the more overdesigned the network is (D >>).
2.
The closer the dots to the diagonal of the diagram are, the closer the network is closer to
the branched- or the looped least-cost design layout. The buffer for irregular supply
scenarios is then also being reduced to a minimum (eventually becoming zero).
3.
The network is under-designed if the dots are positioned below the diagonal of the graph
(D <<); the minimum pressure i.e. design demand is not delivered even at no-pipe failure
condition, because the head at the source(s) is too low for the selected pipe diameters.
4.
The network has lower connectivity in case the dots are positioned closer to the upper X-
axis (indicating small number of pipes).
5.
The network has higher connectivity in case the dots are positioned closer to the lower X-
axis i.e. the origin of the graph (indicating large number of pipes).
5.3
RELATION BETWEEN PIPE FLOW AND LOSS OF DEMAND
Mathematical relation between the pipe flow under regular supply and the loss of demand
after the pipe fails is illustrated in simplified example of two pipes in parallel, shown in
Figure 5.6.
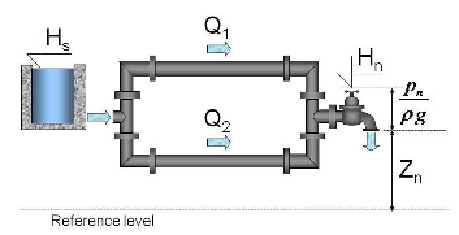
Figure 5.6
Supply through parallel pipes


Search WWH ::

Custom Search