Environmental Engineering Reference
In-Depth Information
10
8
6
4
2
0
0
50
100 150
t
(s)
200
250
300
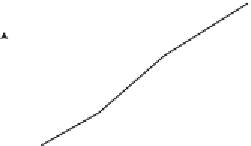
Figure 8.25
Growth of gold particles during glucose oxidation. Reproduced with
permission from [97].
20
16
12
8
4
0
0
200
400 600
catayst amount / mg
800
1000 1200 1400
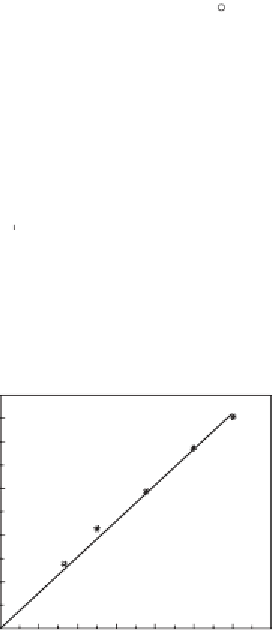
Figure 8.26
Reaction rate vs catalyst amount plot for glucose oxidation. Other reaction
conditions: c
0,glucose
= 20 wt%, 9 bar oxygen, 40
°
C, pH 9. Reproduced with permission from [114].
of the initial glucose concentration. h e maximum activity is obtained at
the highest applied oxygen pressures and 20-30 wt% initial glucose con-
centration. However, the resulting space-time yield of the gold-catalyzed
process at those concentrations is considerably dif erent from the fermen-
tation process. At 20 wt% initial glucose concentration and 9 bar oxygen
pressure, a maximum space-time yield of above 200 gl
-1
h
-1
was achieved
with the gold catalyst, which is much higher than the industrial fermenta-
tion process, maximum space-time yields of 13 gl
-1
h
-1
.
Further study was done to understand the role of dissolved oxygen
on catalytic conversion. Figure 8.28 shows the activity in dependence of


Search WWH ::

Custom Search