Environmental Engineering Reference
In-Depth Information
6000
9.0 bar
6.0 bar
3.0 bar
1.5 bar
5000
4000
3000
2000
1000
0
0
10 20 30
Initial glucose concentration / wt%
40
50
60
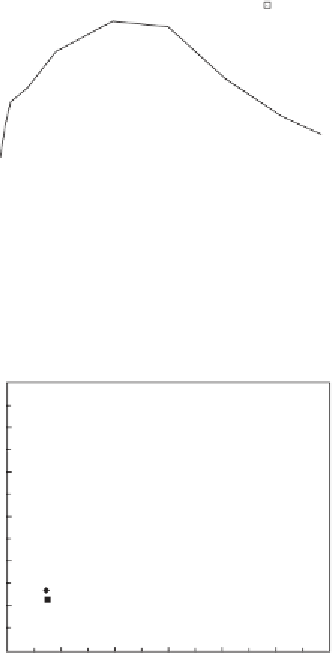
Figure 8.27
Catalyst activity vs initial glucose concentration at 4 dif erent oxygen partial
pressures. Other reaction conditions: 1000 mg catalyst, 40°C, pH 9. Reproduced with
permission from [114].
6000
20 wt% glucose
5000
10 wt% glucose
4000
3000
5 wt% glucose
2 wt% glucose
1 wt% glucose
2000
1000
0
2
4
6
8
10
12
Dissolved oxygen concentration/mmol l
-1
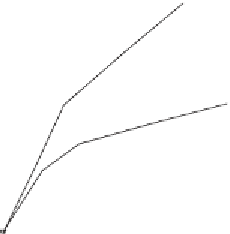
Figure 8.28
Catalyst activity vs calculated dissolved oxygen concentration at dif erent
initial glucose concentrations. Other reaction conditions: 1000 mg catalyst, 40°C, pH 9.
Reproduced with permission from [114].
the calculated dissolved oxygen concentrations at various initial glucose
concentrations. A positive ef ect of an increased dissolved oxygen concen-
tration on the activity can be noted. h e larger the initial glucose concen-
tration is, the higher the activity increase. It was found that by increasing
the glucose concentration up to 20 wt% the oxygen reaction order slightly
l uctuated (rises), but at high concentration of 30-40 wt% the oxygen


Search WWH ::

Custom Search