Geoscience Reference
In-Depth Information
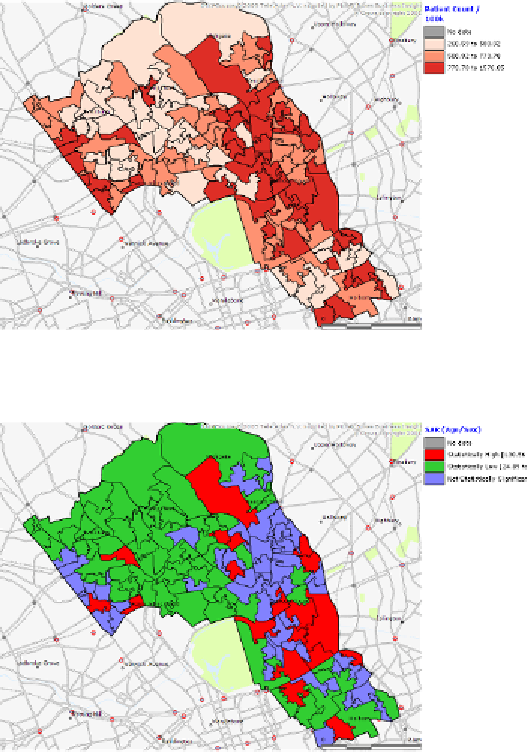
Figure 4:
Map of patient count per 100,000 population for alcohol-related conditions,
2008-2010
Figure 5:
Map of admission rations, standardized by age and sex, for alcohol-related con-
ditions, 2008-2010
For each map, participants rated the strength of their emotional response
on a Likert scale
1
for each of Plutchik's basic emotions
2
(Plutchik 1980).
This permitted effective and efficient assessment of participants' emo-
tional responses. Participants were then invited to indicate if they liked the
map and explain their emotional response. It should be noted that although
1
The scale used was: Very weak, weak, moderate, strong, very strong (1-5).
2
Plutchik's basic emotions are: joy, trust, fear, surprise, sadness, disgust, anger and
anticipation.