Geoscience Reference
In-Depth Information
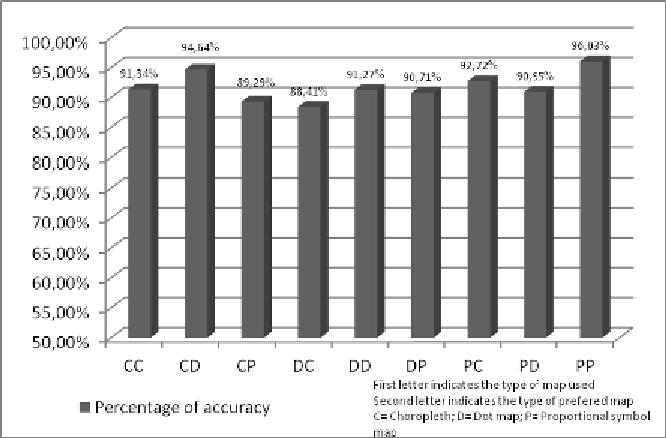
Figure 8:
Map usage, map preference and accuracy for the direct acquisition task
3.3 Map reasoning task
For this analysis, results indicate that dot maps had better performance
(
Table 3
), where an asterisk has been placed next to the “Dot” and “cho”
pair, indicating that this pair shows a statistically significant difference at
the 95.0% confidence level.