Environmental Engineering Reference
In-Depth Information
NOA
3:00 LST
NOA
14:00 LST
2000
2000
MRF-urban
MRF
MRF-dyn
MRF-ther
MRF-urban
MRF
MRF-dyn
MRF-ther
1800
1800
1600
1600
1400
1400
1200
1200
1000
1000
800
800
600
600
400
400
200
200
0
0
0.1
1
10
0
20
40
60 80 100 120 140 160 180 200 220
Diffusion coefficient (m
2
/s)
Diffusion coefficient (m
2
/s)
(a)
(b)
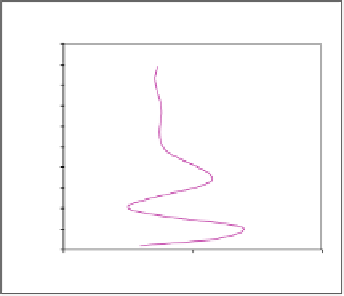
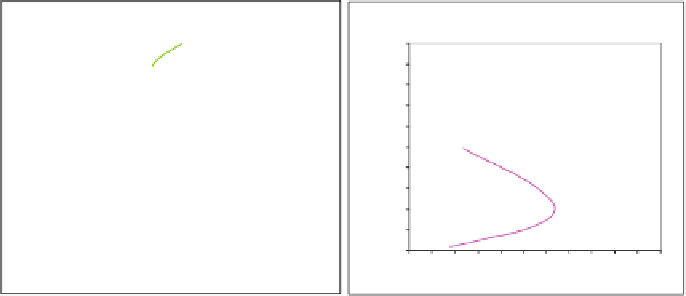
Fig. 10.2
Diffusion coefficient profiles at (
a
) 03:00 of local standard time (LST) and (
b
) 14:00
LST on 14 September 1994 at the NOA stations, as calculated by the MRF, MRF-urban, -dyn and
-ther schemes
MRF run (Fig. 10.5b) (Dandou, et al., 2009). The slowing is mainly attributed to
the significant increase of the roughness length in the urban environment compared
to the rural area. In addition, the developed urban-heat island was displaced inland
5-7 km (not presented).
During the night, the calculated total increase in temperature, diffusion coeffi-
cients, turbulence and fluxes (Figs. 10.2a, 10.3 and 10.4) is due to the increase calcu-
lated by both modifications in both parts. In particular, both the anthropogenic heat
flux and the heat storage flux are released into the shallowmixing height of the atmo-
sphere, producing temperature increase, proportional to the density of buildings and
the human activity. Moreover, the modified diffusion coefficients, under stable con-
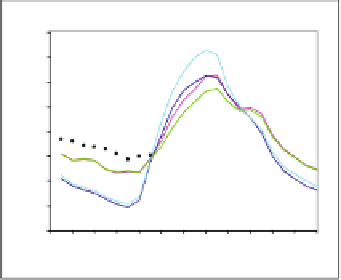
NOA
Marousi
36
36
measurements
MRF-urban
MRF
MRF-dyn
MRF-ther
measurements
MRF-urban
MRF
MRF-dyn
MRF-ther
34
34
32
32
30
30
28
28
26
26
24
24
22
22
20
20
02468 0 2 4 6 8 0 2 4
time (h) LT
02468 0 2 4 6 8 0 2 4
time (h) LT
(a)
(b)
Fig. 10.3
Time series (local diurnal cycle) of air temperature at 10 m agl on 14 September 1994,
as calculated by the MRF, MRF-urban, -dyn and -ther schemes and measured (black circles) at the
(
a
)NOAand(
b
) Marousi stations


Search WWH ::

Custom Search