Environmental Engineering Reference
In-Depth Information
NOA
Marousi
400
400
measurements
MRF-urban
MRF
MRF-dyn
MRF-ther
measurements
MRF-urban
MRF
MRF-dyn
MRF-ther
350
350
300
300
250
250
200
200
150
150
100
100
50
50
0
0
-50
-50
02468 0 2 4 6 8 0 2 4
02468 0 2 4 6 8 0 2 4
time (h) LT
time (h) LT
(a)
(b)
NOA
Marousi
0.7
0.7
measurements
MRF-urban
MRF
MRF-dyn
MRF-ther
0.6
0.6
mesurements
MRF-urban
MRF
MRF-dyn
MRF-ther
0.5
0.5
0.4
0.4
0.3
0.3
0.2
0.2
0.1
0.1
0
0
02
468 0 2 4 6 8 0 2 4
02
4 6 8 1012141618202224
time (h) LT
time (h) LT
(d)
(c)
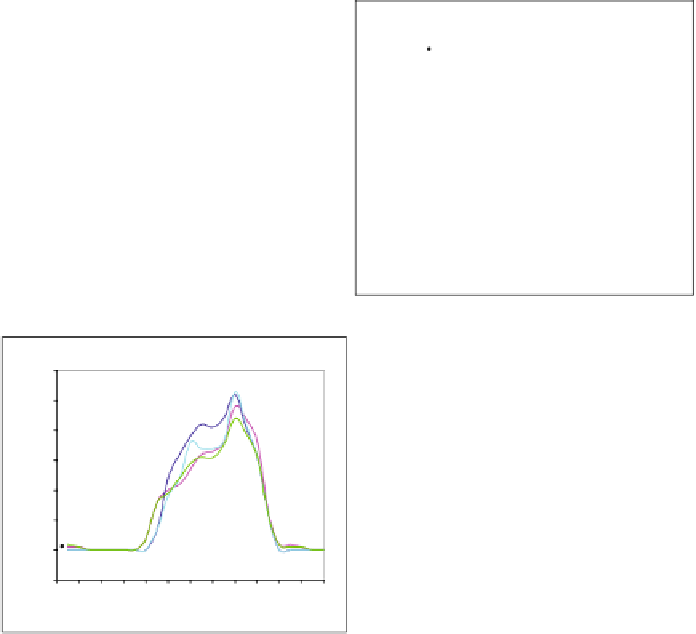
Fig. 10.4
Time series (local diurnal cycle) of sonic anemometer turbulence measurements of sen-
sible heat flux (
a
and
b
) and friction velocity (
c
and
d
) at the NOA and Marousi sites, at 15 m agl,
together with MRF, MRF-urban, -dyn and -ther modelling results on 14 September 1994
m/s
-1.50 to -1.25
-1.25 to -1.00
-1.00 to -0.75
-0.75 to -0.50
-0.50 to -0.25
-0.25 to 0.00
0.00 to 0.25
0.25 to 0.50
0.50 to 0.75
0.75 to 1.00
1.00 to 1.25
1.25 to 1.50
1.50 to 1.75
1.75 to 2.00
2.00 to 2.50
m/s
-1.50 to -1.25
-1.25 to -1.00
-1.00 to -0.75
-0.75 to -0.50
-0.50 to -0.25
-0.25 to 0.00
0.00 to 0.25
0.25 to 0.50
0.50 to 0.75
0.75 to 1.00
1.00 to 1.25
1.25 to 1.50
1.50 to 1.75
1.75 to 2.00
2.00 to 2.50
45
45
40
40
35
35
30
30
Marousi
Marousi
25
25
NOA
Peiraias
NOA
Peiraias
20
20
15
15
10
10
5
5
5 0 5 0 5 0 5 0 5 0 5
(x 2km)
5 0 5 0 5 0 5 0 5 055
(x 2km)
(a)
(b)
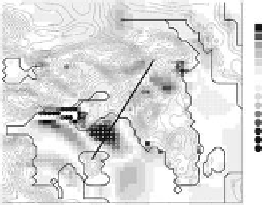
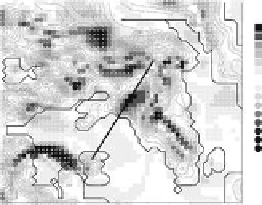
Fig. 10.5
The spatial distribution of horizontal wind speed differences in m s
−
1
(at 10 m agl)
between the MRF-urban and 'no-city' run, at (
a
)3:00LSTand(
b
) 14:00 LST on 15 September
1994


Search WWH ::

Custom Search