Environmental Engineering Reference
In-Depth Information
(a)
(b)
(c)
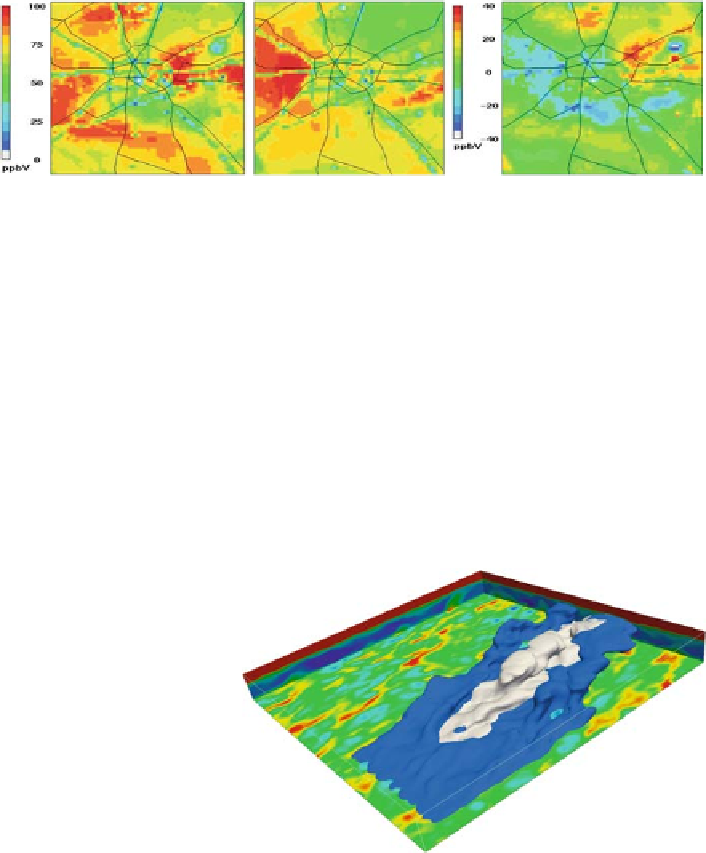
Plate 3
Simulations of surface ozone using CMAQ driven by UCP
(a)
and No-UCP
(b)
versions
of MM5 (see Fig. 1.2) and
(c)
differences between simulations (at 2100 GMT on August 30, 2000)
(See also Figure 1.3 on page 8)
Plate 4
Instantaneous
contour plot of the
concentration fields for the
two emission scenarios (64%
in
blue
and 16% in
grey
)after
two hours of simulation and
with a threshold of 0.1 ppb.
The potential temperature is
also shown as coloured
surfaces (See also Figure 2.2
on page 14)
Search WWH ::

Custom Search