Environmental Engineering Reference
In-Depth Information
In the hope to serve as inspiration for future measurements in urban areas some
results from a campaign over a forest using wind LiDAR are presented. There are
many similarities in the structure of the turbulence and wind field over a forest and
an urban area, but it should be noted that inside the forest canopy and street canyons
the conditions are very different. The forest campaign took place in 85 year old
beech forest on the island of Zealand (Denmark). The area is flat. The beech trees
are on the average 25 m tall with scattered stands of conifers. The displacement
height is 20.6 m and the roughness length 1.8 m (Dellwik and Jensen, 2005).
A wind LiDAR was installed on a mast 40 m above ground and 15 m above the
trees. It consists of a focused continuous wave laser beam scanning conically at an
angle of
30
◦
. The instrument measures the Doppler-shift of the light backscatter
signal which comes from particles in the atmosphere, and this is then transformed
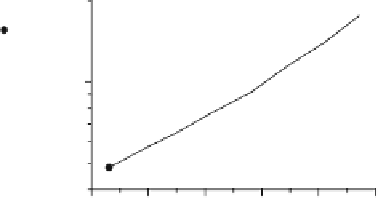
into a horizontal and vertical wind velocity. Figure 12.3 shows an example of a half
hourly averaged wind profile above the forest. It can be seen that the wind profile is
smooth with an indication of a jump at
≈
90 m.
The corresponding wind direction is shown in Fig. 12.4. Over the main part of
the profile except at the lowest level, a weak clockwise turning (veering) can be
observed in accordance with the Ekman spiral. The turning over the whole layer is
about 3.5
◦
which is about the same as the uncertainty for wind direction measure-
ments by wind vanes. It should be noted that the above wind direction profile could
not have been detected in measurements from a tall mast equipped with a dense
profile of wind vanes.
More interesting, however, are the results when the wind LiDAR was shoot-
ing horizontally over the forest, in this case in a range between 20 and 60 m
from the LiDAR, 15 m above the 25 m tall trees. Two examples are shown aver-
aged over half an hour for high and low wind speed conditions (Fig. 12.5). A
considerable variability in the mean wind speed in a range of only 40 m can be
observed, ranging from 9.3 to 10.6 m s
−
1
for the high and from 1.5 to 2.1 m s
−
1
for the low wind speed case. Similar plots from the campaign show a comparable
≈
200
200
180
160
140
100
120
90
80
70
60
50
40
100
80
60
40
6
7
8
9
10
11
6
7
8
9
10
11
Mean wind speed (ms
-1
)
Mean wind speed (ms
-1
)
(b)
(a)
Fig. 12.3
Wind profile (m s
−
1
) above a 25 m high forest as a function of height on the
(a)
linear
and
(b)
logarithmic scales


Search WWH ::

Custom Search