Environmental Engineering Reference
In-Depth Information
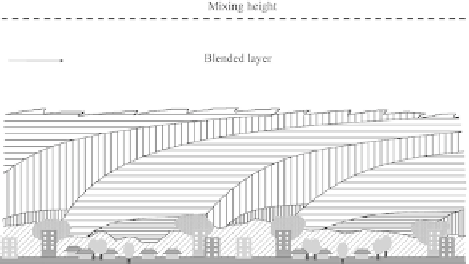
Fig. 12.1
Schematics of the boundary layer structure over an urban area. The vertical and hori-
zontal patterns represent the underlying surface of the neighbourhoods of tall and low buildings,
respectively. Broad spaced patterns represent the urban internal boundary layers where advection
processes are important. Fine spaced patterns show the inertial sublayers that are in equilibrium
with the underlying surface and where Monin-Obukhov scaling applies. The forward slash pattern
represents the roughness sublayer that is highly inhomogeneous both in its vertical and horizon-
tal structure. The dotted pattern represents adjustment zones between neighbourhoods with large
accelerations and shear in the flow near the top of the canopy. Above the height where the inter-
nal boundary layers are intermixed the effects of the individual neighbourhoods cannot be distin-
guished any more - the so-called blended layer
taken as a dynamical definition of the depth of the roughness sub-layer. Thus point
measurements in urban areas can be problematic.
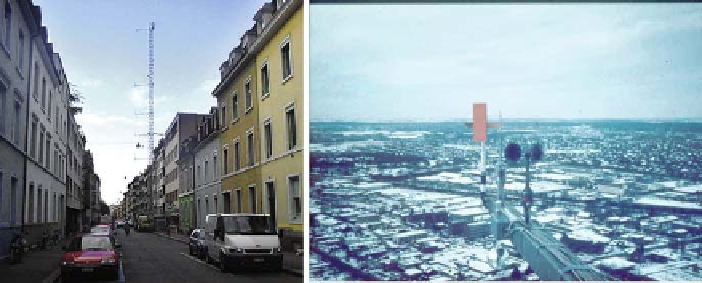
The height of the roughness sub-layer is generally considered to be 3-5 times
the building height (Fig. 12.2). In many experimental campaigns the meteorological
masts in urban areas are placed on top of buildings reaching rarely beyond one or
two building heights so are typically within the roughness sub-layer. Interpretation
of the measurements therefore, should be done in the framework of roughness sub-
layer considerations, as surface layer theory as Monin-Obukhov similarity is not
applicable (see also Feddersen, B., 2005).
Fig. 12.2 (a)
Mast in the BUBBLE experiment (Rotach et al., 2004) where measurements rep-
resent the roughness sub-layer.
(b)
Copenhagen experiment (Gryning and Lyck, 1984) where the
measurements were performed above the roughness sub-layer
Search WWH ::

Custom Search