Information Technology Reference
In-Depth Information
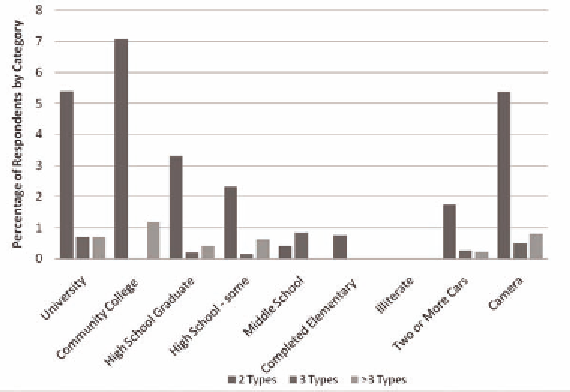
Figure 2. Characteristics of respondents with multiple access types, 2006
percent of respondents) followed by 20 hours per
week (17 percent of respondents). 20 hours per
week was the most frequently reported response
of mobile users (22 percent) followed by 5 hours
and 10 hours per week (18 percent and 16 percent,
respectively).
There are different ways of measuring usage.
We focus primarily on hours and types of usage;
however, access bandwidth also is important. For
example, respondents were asked which package
offered by their provider they had chosen. In some
instances the package information obtained in
the survey included bandwidth (e.g., Sapo offers
a 2MB, 4MB, and 8MB package, among others;
TvTel offers 256 1GB, 256 3GB, 256 SL and
512 SL; Via Networks offers 512K, 768K, and
1024K, among others), but in other instances only
the name of the plan was given, not the features.
Surveys show that hours of use and types of
usage are fairly consistent across age groups and
regions in Portugal, even though variations are
statistically significant in econometric models
(details of which are below). Similarly, types of
usage are similar across access types. Mobile ac-
cess is slightly greater for financial applications
than fixed access is, and fixed acces is slightly
greater for entertainmet, news, and downloading
of music, games, and movies. This might occur
because mobile broadband is associated with
higher-income users than is fixed broadband.
Figure 3 illustrates these results.
Empirical models analyzing the difference in
usage between narrowband and broadband users
consider both the impact of fixed versus mobile
access on hours of use and the purpose of use
(making purchases, bank transfers, filing taxes),
after controlling for individual/household char-
acteristics. This suggests the extent to which
narrowband and broadband are substitutes, and
similarly the extent to which fixed and mobile
broadband are used for similar purposes.
The empirical results indicate that older respon-
dents tend to have lower hours of use; those age
25 to 44 have the highest usage among various
age groups.
17
Wealthier respondents have higher
hours of use. More densely populated and urban
areas have higher usage as well. The more densely
populated areas of Portugal also have higher per
capita GDP and the marginal cost of providing
broadband should be lower in more densely
populated areas than in less densely populated
Search WWH ::

Custom Search