Information Technology Reference
In-Depth Information
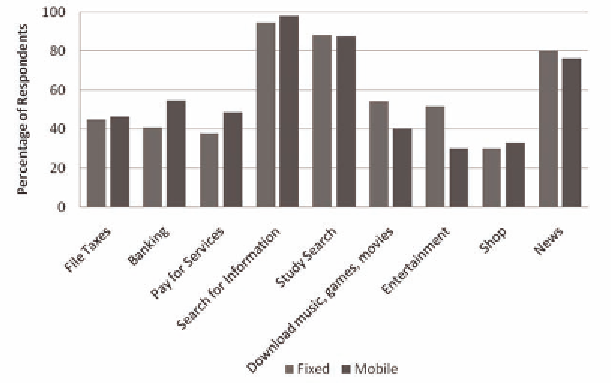
Figure 3. Patterns of us by access type, 2006
areas. Finally, there exists a negative relationship
between satisfaction with speed and hours of use.
Logistic regressions suggest that mobile sub-
scribers are not different from other broadband
subscribers with respect to financial applications;
only narrowband proved to be significant in terms
of access mode. Education remains a primary
indicator of Internet usage. There are variations
across regions once other socio-economic charac-
teristics are controlled for, for example, almost all
regions, Madeira being the exception, have lower
propensity to use Internet financial services than
Grande Lisboa (the reference region).
With respect to non-financial uses, in general
a few trends stand out. First, age is significant for
entertainment uses (those reporting downloading
music, games, and videos, as well as entertain-
ment); younger users consistently access the
Internet for non-financial uses at a greater level
than older users. Also, education is significant
for news-related uses; users with more years of
education access the Internet for news at a greater
level than less-educated users. As might be ex-
pected, the length of time the respondent has had
home Internet access is significantly correlated
with online shopping, perhaps indicating that
those more familiar with Internet use become
more trusting of Internet shopping opportunities.
Mobile broadband users are less likely than DSL
broadband users to use broadband for most of the
non-financial uses.
Surveys indicated that fixed service customers
are more likely to be frequent broadband users than
other access customers, but nomadic customers
may be different than fixed or mobile customers.
Both fixed and mobile show similar usage profiles:
between 40 and 50 percent of the customers of
each access type use broadband several times
each day, a little more than 25 percent use it at
least once each day, and less than 10 percent use it
less than once per week. The nomadic customers
have a flatter distribution: less than 40 percent use
it several times a day, more than 30 percent use
it once per day, and over 20 percent use it twice
per week. This is consistent with what we might
expect of nomadic users: at least some of them
would have to physically go to a hotspot to access
the Internet and this inconvenience would lower
the number of times they use broadband relative
to users that have it available at home (i.e., fixed
and mobile subscribers) or with them as they move
about (i.e., mobile subscribers).
18
Portions of our analyses considered differ-
ences between users of fixed, mobile, and no-
Search WWH ::

Custom Search