Geoscience Reference
In-Depth Information
10 dm
3
s
1
, and
DH
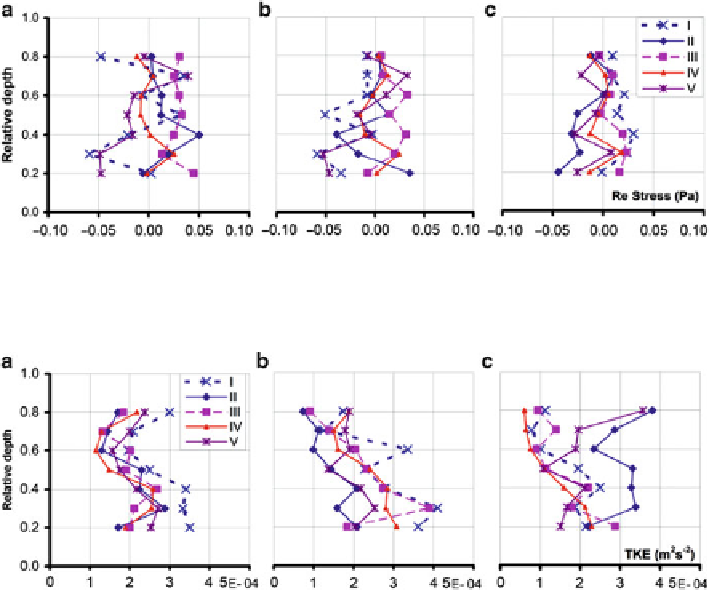
Fig. 6 Reynolds stress at
X
¼
1.0 m,
Q
¼
¼
0(a),
DH
¼
10 (b), and
DH
¼
30 cm (c)
10 dm
3
s
1
, and
DH
Fig. 7 TKE at
X
¼
1.0 m,
Q
¼
¼
0(a),
DH
¼
10 (b), and
DH
¼
30 cm (c)
and 30 cm (Fig.
5c
) acting in the bottom. Figure
6
depicts the profiles of the
Reynolds stresses and Fig.
7
depicts the TKE as a function of the relative water
depth.
Based on Fig.
5
, there is no clear evidence that the seepage influences the open-
channel hydrodynamics. Nevertheless, seepage is influencing the turbulence para-
meters as depicted in Figs.
6
and
7
. In Fig.
6
it is possible to observe that the seepage
is smoothing the gradient of the Reynolds stresses while in Fig.
7
, the shapes of the
TKE profiles are more regular when there is no seepage flow.
The seepage flow is affecting more the behavior of the velocity fluctuations
than the mean values of the velocity. Figure
8
depicts two histograms of the
V
x
measurements without seepage (a) and with upward seepage (b). The blue dashed
lines represent the normal distribution of the correspondent means and standard
deviations. The histogram (a) is closer in shape to the normal distribution than
(b), and (b) is right skewed with a kurtosis lower than zero. Nevertheless, these
histograms represent only one of the time-series. Therefore, the histograms of the
V
x
kurtoses (Fig.
9a-c
), the
V
y
kurtoses (Fig.
9d-f
), and the
V
x
skewness (Fig.
9g-i
)
of all the flow measurements without (
DH
¼
0 cm) and with seepage (
DH
¼
10
and 30 cm) were categorized in 16 data classes and analyzed.