Geoscience Reference
In-Depth Information
Equation
10
is corrected by subtracting 3 in order to make the kurtosis of the
normal distribution equal to zero (Czernuszenko and Holley
2007
)
. In
the case of
turbulence parameters, the Reynolds stresses in the
xy
-plane
u
0
v
0
are directly
calculated from the velocity fluctuations while the TKE is defined in the (
11a
), but
at the laboratory is estimated by the relation (
11b
) (Garcia et al.
2005
):
r
1
2
u
i
u
i
k
(11a)
1
2
V
0
x
þ
V
0
y
þ
V
0
z
k
¼
(11b)
where
V
0
x
,
V
0
y
,
and
V
0
z
are the variance of the flow velocity components in
x
,
y
, and
z
,
respectively. Nevertheless, a correction of the TKE is to be applied because the
velocimeter used for the experiments only provided the velocity components in two
directions. Hence, formula (
11b
) is corrected (Liiv and Lagemaa
2008
):
1
:
33
2
V
0
x
þ
V
0
y
k
(12)
In the next section, a detailed statistical analysis of the turbulent flow measure-
ments, for the flow rate
Q
10 dm
3
s
1
at the cross section
X
1.0 m without
seepage and with two hydrostatic pressures that induced seepage through the flume's
bed (
DH
¼
¼
10 and 30 cm), is presented. The magnitude of the groundwater flow
velocities measured at the laboratory oscillated between 3.3 and 4.6
¼
E
5
ms
1
.
Thus, this small seepage flow was around 0.011-0.015% of the open-channel flow.
2.3 Experimental Results
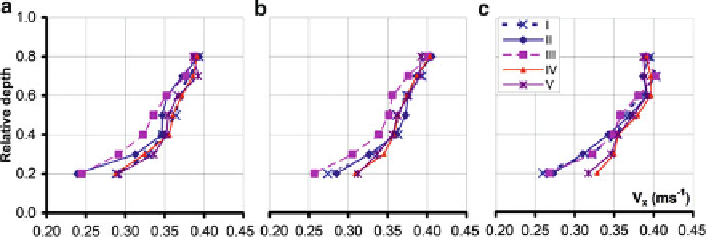
Figure
5
depicts the mean velocity profiles (five profiles according to Fig.
3
)as
a function of the relative depth at the cross section
X
¼
1.0 m without seepage
(Fig.
5a
) and with induced hydraulic heads corresponding to 10 cm (Fig.
5b
)
10 dm
3
s
1
, and
DH
Fig. 5
V
x
at
X
¼
1.0 m,
Q
¼
¼
0(a),
DH
¼
10 (b) and
DH
¼
30 cm (c)