Environmental Engineering Reference
In-Depth Information
It is clear that the more distributed the wind farms, the tighter and more symmetric
is the error distribution. The distributions for the 6-hour look-ahead time are seen to
be marginally tighter than those for the 12-hour look-ahead time. However, it is
also clear that there were low occurrences of large errors, which would be very
significant from a power system operator point of view. The maximum forecast
errors of individual wind farms, both positive and negative, were found to be very
large. Aggregation was found to reduce the maximum errors, but only marginally.
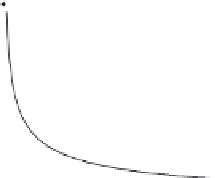
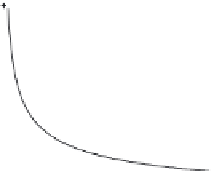
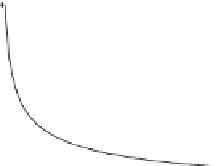
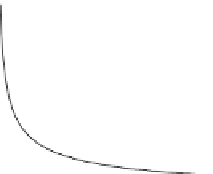
Another interesting feature of aggregation can be explored by plotting the
correlation coefficient between the errors at all pairs of wind farms against distance
between the wind farms. This is shown in Figure 6.19 for four different look-ahead
times. It is clear that correlation between forecast errors drops off markedly with
distance, so that at a distance of 100 km or more the correlation is very weak.
Strong correlation between the forecast errors at wind farms would be detrimental
from a power system operator point of view. The rapid drop off with distance
confirms the benefits in having the wind power generation resource as geo-
graphically dispersed as possible (see Section 5.3.2).
6.5.2 Statistical models
In the statistical modelling approach, the key tasks of downscaling and the con-
version from wind forecast to power forecast described earlier for the physical
1
1
+6 h
+24 h
0.8
0.8
0.6
0.6
0.4
0.4
0.2
0.2
0
0
1
1
+12 h
+48 h
0.8
0.8
0.6
0.6
0.4
0.4
0.2
0.2
0
0
0
100
200
300
400
0
100
200
300
400
Distance (km)
Distance (km)
Figure 6.19
Correlation between forecast errors at pairs of wind farms plotted
against distance between them


Search WWH ::

Custom Search