Environmental Engineering Reference
In-Depth Information
Figure 6.12
Directionally dependent wind farm power curve
Time t
120
forecast at t-18
forecast at t-12
forecast at t-6
forecast at t
measured
100
80
60
40
20
0
25
26
27
28
29
Time (days)
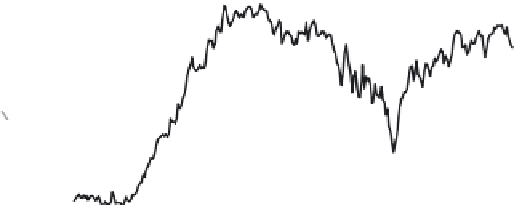
Figure 6.13
Wind power forecasts for look-ahead times of 0-48 hours provided at
times t, t-6, t-12 and t-18 hours
The output of the wind power forecasting model is the wind power forecast,
which typically provides hourly predictions for look-ahead times up to 48 hours.
The forecasts can be provided for specific wind farms, for a portfolio of wind farms
or for all wind farms in a particular region or supply area. In Figure 6.13, four sets
of successive wind power forecasts for a group of wind farms (at
t
,
t
-6,
t
-12 and
t
-18 hours) are overlaid, together with the measured power. The forecasts are for
look-ahead times in the range 0-48 hours.


Search WWH ::

Custom Search