Biology Reference
In-Depth Information
50
Hypoglycemia
Target Range
Hyperglycemia
40
30
20
Clinical and
Numerical
Center
10
0
−
2.5
−
2
−
1.5
−
1
−
0.5
0
0.5
1
1.5
2
2.5
Symmetrized Data Range
Transformed BG Level
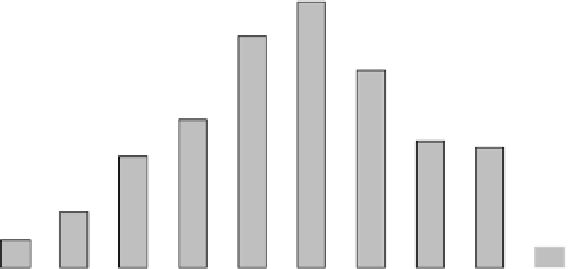
FIGURE 5-7.
Distribution of BG levels in the transformed scale. Note the symmetry of the bar graph and how
well the normal distribution fits the transformed data. (
#
1997 American Diabetes Association.
From Diabetes Care, 20, 1655-1658. Reprinted with permission from The American Diabetes
Association. Used by permission of Taylor & Francis, Ltd. [
http://www.informaworld.com]).
We now know our transformation works for one subject. Are we done?
Of course not! We must test other subjects. We ran SMBG data sets for
205 people with diabetes and looked at their individual BG distributions
with the transformed scale. All of the histograms in the transformed
scale resulted in symmetric distributions, and the normality hypotheses
for only two out of the 205 were rejected at a p-level of 0.005 (note
that with more than 200 tests this p-level practically guarantees this
should happen).
In summary, we solved the following problem: the typical distribution of
SMBG readings of a person with T1DM is substantially skewed; that is,
the numerical center of the data is substantially separated from its
clinical center. Thus, clinical conclusions based on numerical methods
will be less accurate for the constricted hypoglycemic range. The
solution was to introduce a data transformation that symmetrizes the BG
scale around a single numerical/clinical center of 6.25 mmol/L and
converts a typical distribution of BG readings into a normal distribution.
This approach establishes a mathematical foundation for risk analysis of
BG data through introduction of the BG risk function.
VI. THE BLOOD GLUCOSE RISK FUNCTION
Now we want to create a risk function that will assign a risk
value to each BG level from 1.1 to 33.3 mmol/L. Figure 5-8 presents
a quadratic risk function superimposed over the transformed BG