Biology Reference
In-Depth Information
readings/empirical variance of another sample with N readings) as
their test statistic, requires the use of a F-distribution (as it is
approximately Chi-square/Chi-square) with M, N degrees of
freedom.
We will usually have a group of data for which we need to choose which
statistical test to perform, based on the question at hand. Once this has
been decided, we shall use standard statistical software, such as
MINITAB or SPSS, to carry out the computations. When this is done, we
should be able to interpret the output. We begin by outlining the
fundamentals of formulating a hypothesis and performing statistical
testing.
III. STATISTICAL TESTING
A.TestingaHypothesis
In hypothesis testing, we make a claim and then gather data to evaluate
this claim. The claim is called the null hypothesis. The negation of the null
hypothesis is called the alternative hypothesis. The exact criteria used for
the evaluation are based on knowledge of probability distributions
coming from statistical theory. In this text, the claims will most often be
about the value of a distribution parameter. The salient point is:
Assuming that the null hypothesis is correct, we want to be able to
calculate the probability that the sample we took could occur. For
example, suppose the null hypothesis for the mean value
m
of a
probability distributio
n
is that
0 and we take a sample of size 20 and
find the sample mean x is 0.7. Suppose also statistical theory says that if
the null hypothesis is correct, the probability distribution of the means of
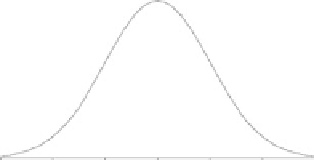
the samples of size 20 will be as shown in Figure 4-3(A). In Figure 4-3(B),
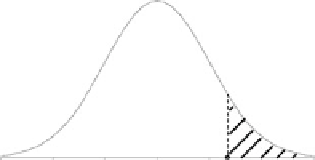
we locate the particular value of our sample and shade the area under the
probability density curve to the right of this value. The area of the shaded
region represents the probability the sample mean we took would have
been 0.7 or larger, if the null hypothesis is correct. This probability is the
p-value corresponding to the empirical result of 0.7. A very small p-value
would indicate the observed mean is very unlikely to have occurred
among all samples of size 20 if the null hypothesis was, in fact, true, and
therefore provides enough evidence for rejecting the null hypothesis. If
the evidence from the data gathered provides enough confidence to reject
the null hypothesis, this is also evidence in favor of the alternative
hypothesis.
m
A
0
B
0
0.7
FIGURE 4-3.
Standard normal distribution. Panel A:
Probability distribution for the means of samples
of size 20; panel B: The area of the shaded
region represents the probability that in taking a
sample of size 20 we would get a sample mean
of 0.7 or larger if the null hypothesis is correct.
To illustrate these concepts with a specific example, we return to the two
types of corn and ask whether the genetically engineered variety B
produces higher average yields than the original variety A. The yields


