Environmental Engineering Reference
In-Depth Information
300
History
Projections
250
200
Industrialized
150
Developing
100
EE/FSU
50
0
1970
1980
1990
2000
2010
2020
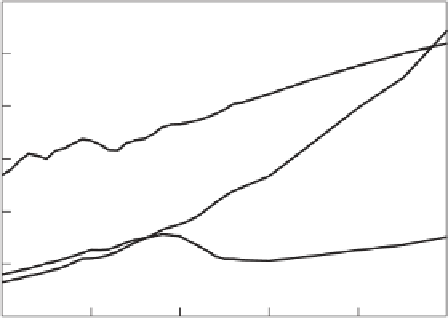
Figure 2.1
Trend of world's energy consumption for 1970-1997 and a projection to 2020. (Data from U.S.
Department of Energy, Energy Information Agency, 2000.
International Energy Outlook 2000
.)
countries, also called “developed” countries, consumed 54% of the world's energy, the “less de-
veloped” countries consumed 31.5%, and the eastern European and former Soviet Union coun-
tries consumed 14.5%. It is interesting to note that in 2020, the projection is that the less devel-
oped countries will consume a greater percentage of the world's energy than the industrialized
countries.
Table 2.1 lists the 1996 population, total energy use, Gross Domestic Product (GDP), energy
use per capita, and energy use per GDP of several developed and less developed countries. The
United States is the largest consumer of energy (88.2 Q), followed by China (35.7 Q) and India
(30.6 Q). The United States consumes 23.2% of the world's energy with 4.6% of the world's
population; western Europe consumes 16.7% of the world's energy with 6.5% of the world's
population. China consumes about 10% of the world's energy with 21% of the world's population,
whereas India consumes 3% of the energy with 16.3% of the population.
Among the listed countries, Canada, Norway, and the United States are the world's highest
users of energy per capita: 395, 390, and 335 million Btu per capita per year, respectively. Russia
consumes 181 MBtu/cap y, Japan 171, United Kingdom 169, Germany 168, and France 162. The
less developed countries consume much less energy per capita. For example, Mexico consumes
59 MBtu/cap y, Brazil 43, China 29.4, Indonesia 54.1, and India 32.6. The world average consump-
tion is 63 MBtu/cap y.
If we compare the energy consumption per GDP, a different picture emerges. Among developed
countries, Canada uses 24.5 kBtu/$ GDP (reckoned in constant 1987 dollars), Norway 16.7, United
States 16.2, United Kingdom 12.5, Germany 9.1, France 9, Italy 8.4, and Japan 7.1. Canada, Norway,
and the United States use more energy per GDP than the other western European countries and
Japan, in part because of the colder climate, larger living spaces, longer driving distances, and
larger automobiles. On the other hand, Russia and the less developed countries (with the exception
of Brazil) spend a higher rate of energy per dollar GDP than do Canada, United States, Japan, and
the European countries: Russia (108.3 kBtu/$ GDP), Indonesia (81), China (67), and Mexico (36).
This is an indication that much of the population in these countries does not (yet) contribute
significantly to the GDP. Furthermore, their industrial facilities, power generation, and heating